Civic Tech Field Guide
Sharing knowledge and productively growing the fieldThe Tech > Civic data > Mapping > Civic maps - (170)
Civic maps collect and display data geographically to coordinate action, plot resources, or make an argument for change. This is our gallery of specific civic maps.
Showing 170 Results


Interactive map ranking the noise of every US city over 100,000 people, built from federal US DOT/BTS National Transportation Noise Map data (CC BY 4.0).
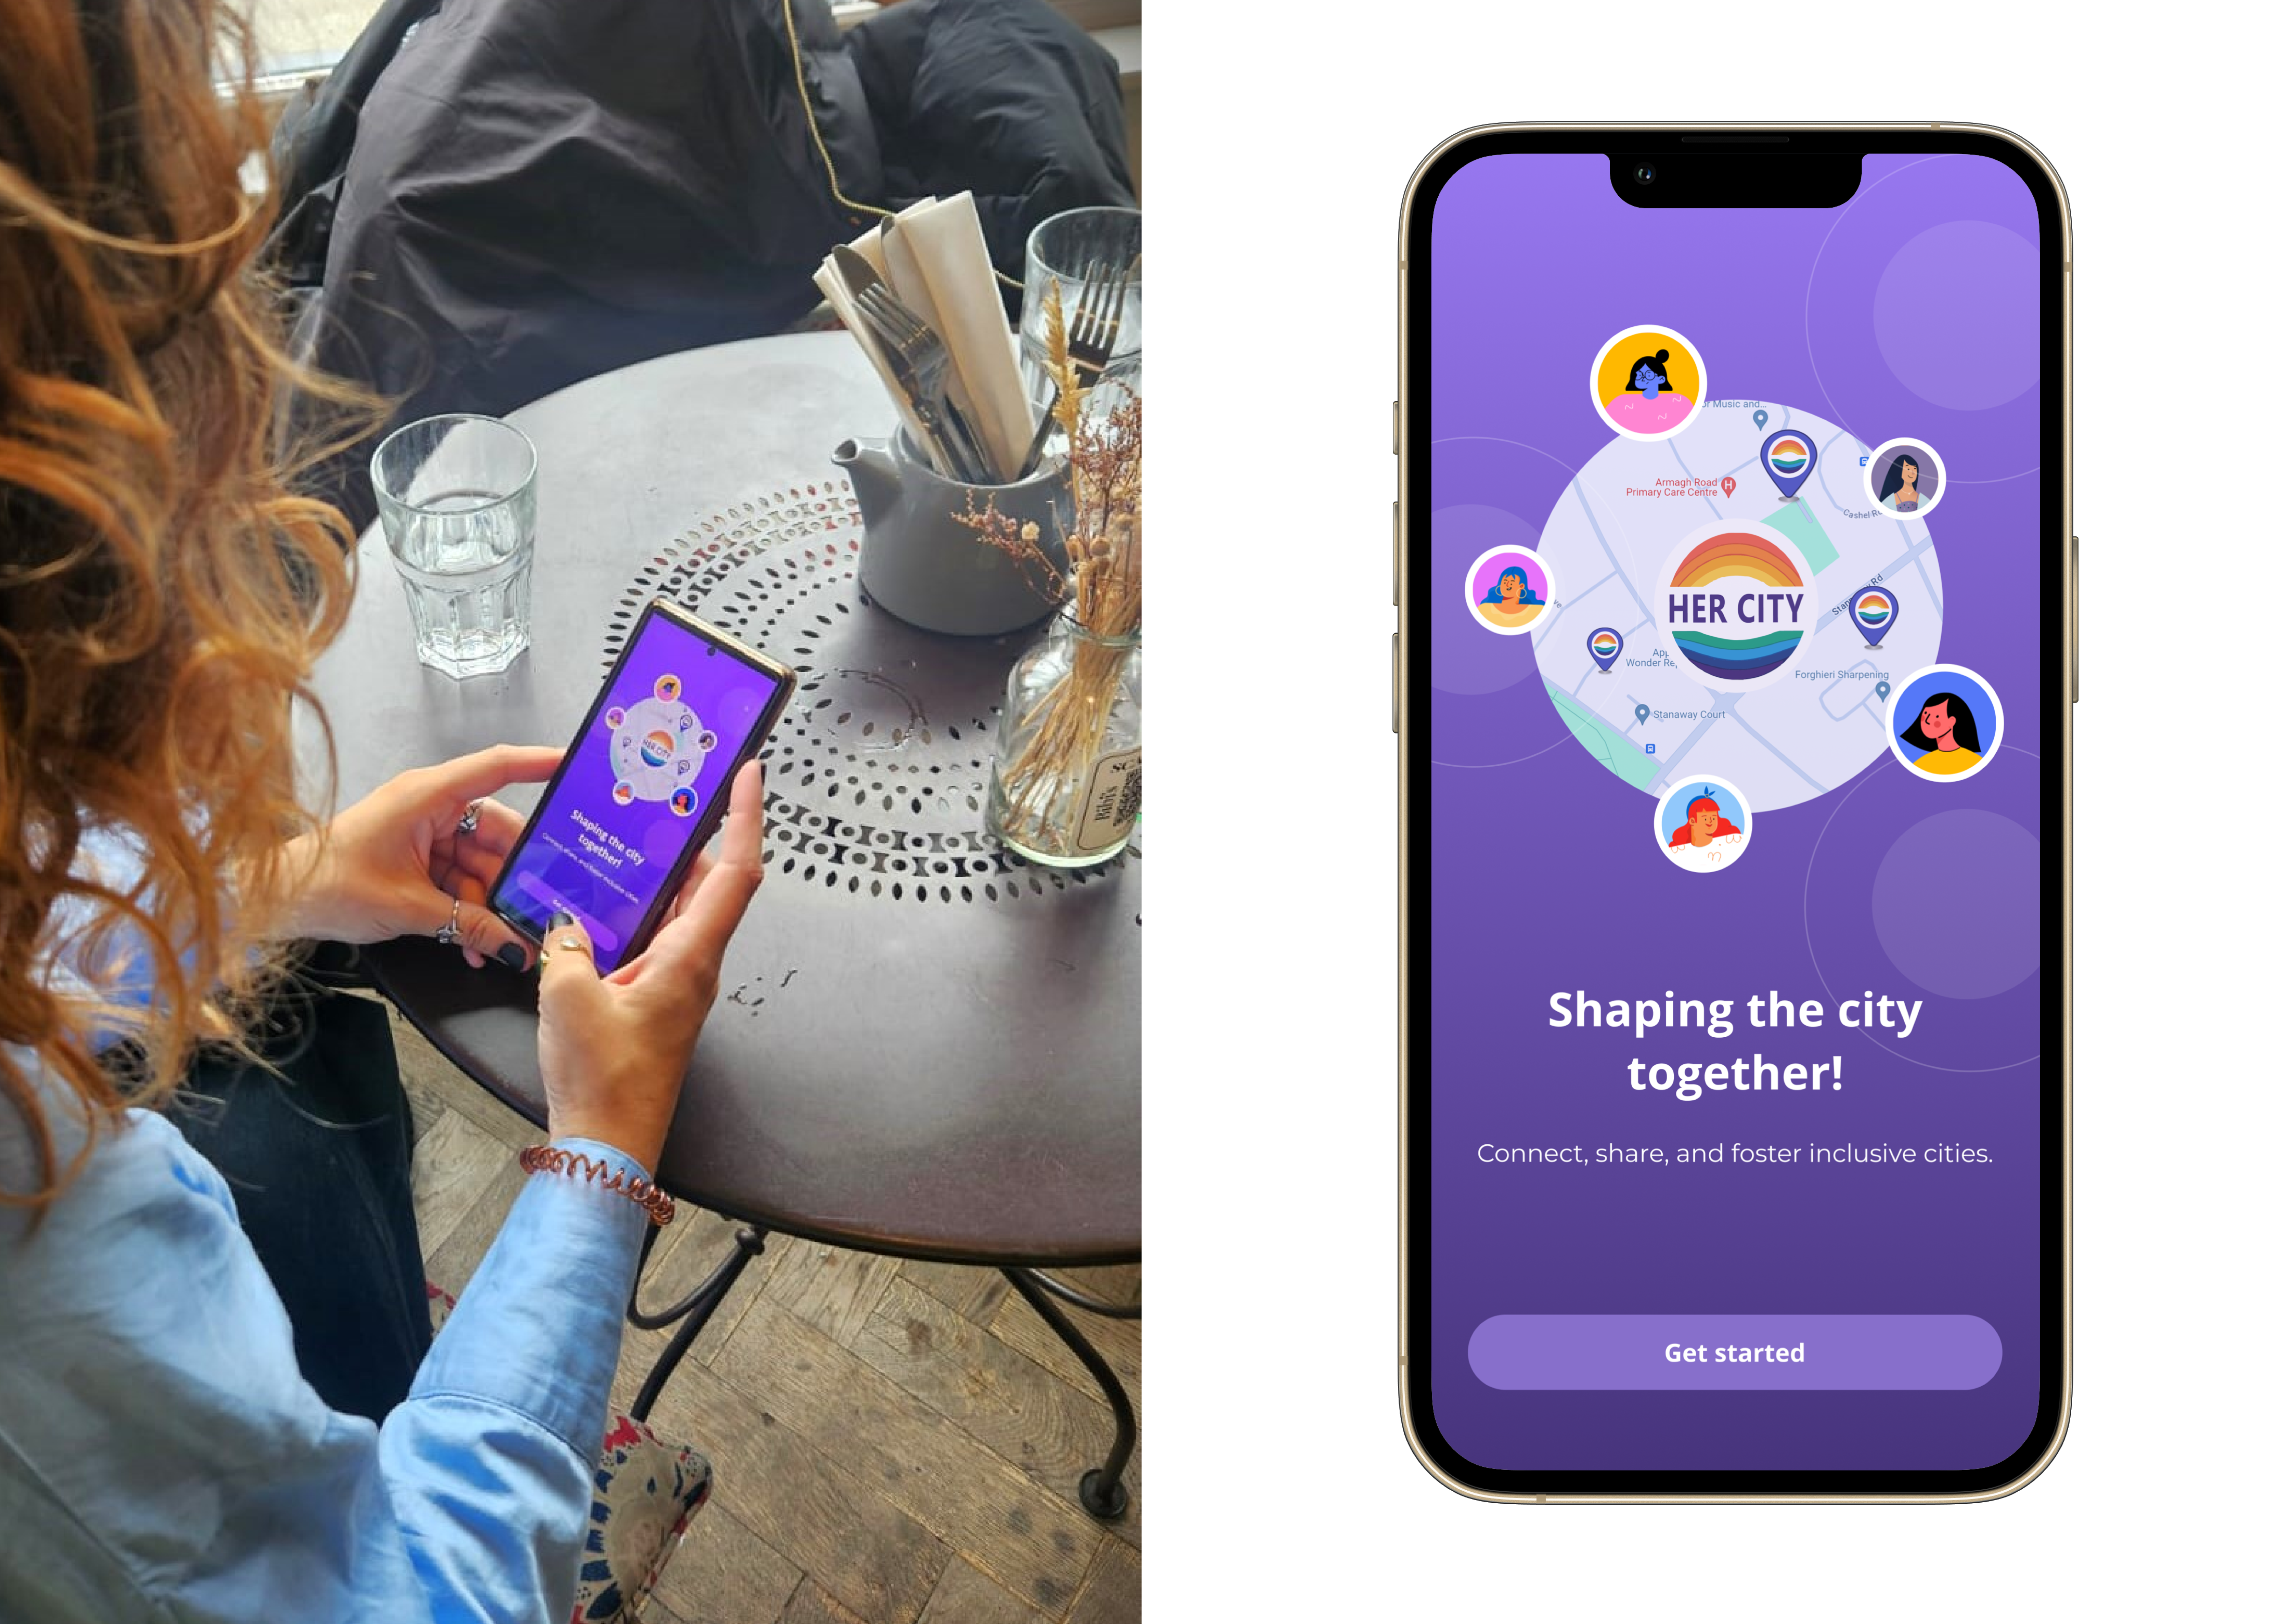
Shaping HerCity
Dublin, IrelandCivic tech and urban safety project that uses participatory research and co-design with women and LGBTQ+ communities to map safe/unsafe spaces and build community-driven tools— including a safe space certification, anti-harassment interventions, and a digital platform for trusted mobility, peer support, and collective care.
Russia-Ukraine ConflictMisinfo
TorontoThe portal is a resource for analysts, researchers, and members of the public who are interested in understanding the nature and scale of online misinformation and disinformation about the Russia-Ukraine war.
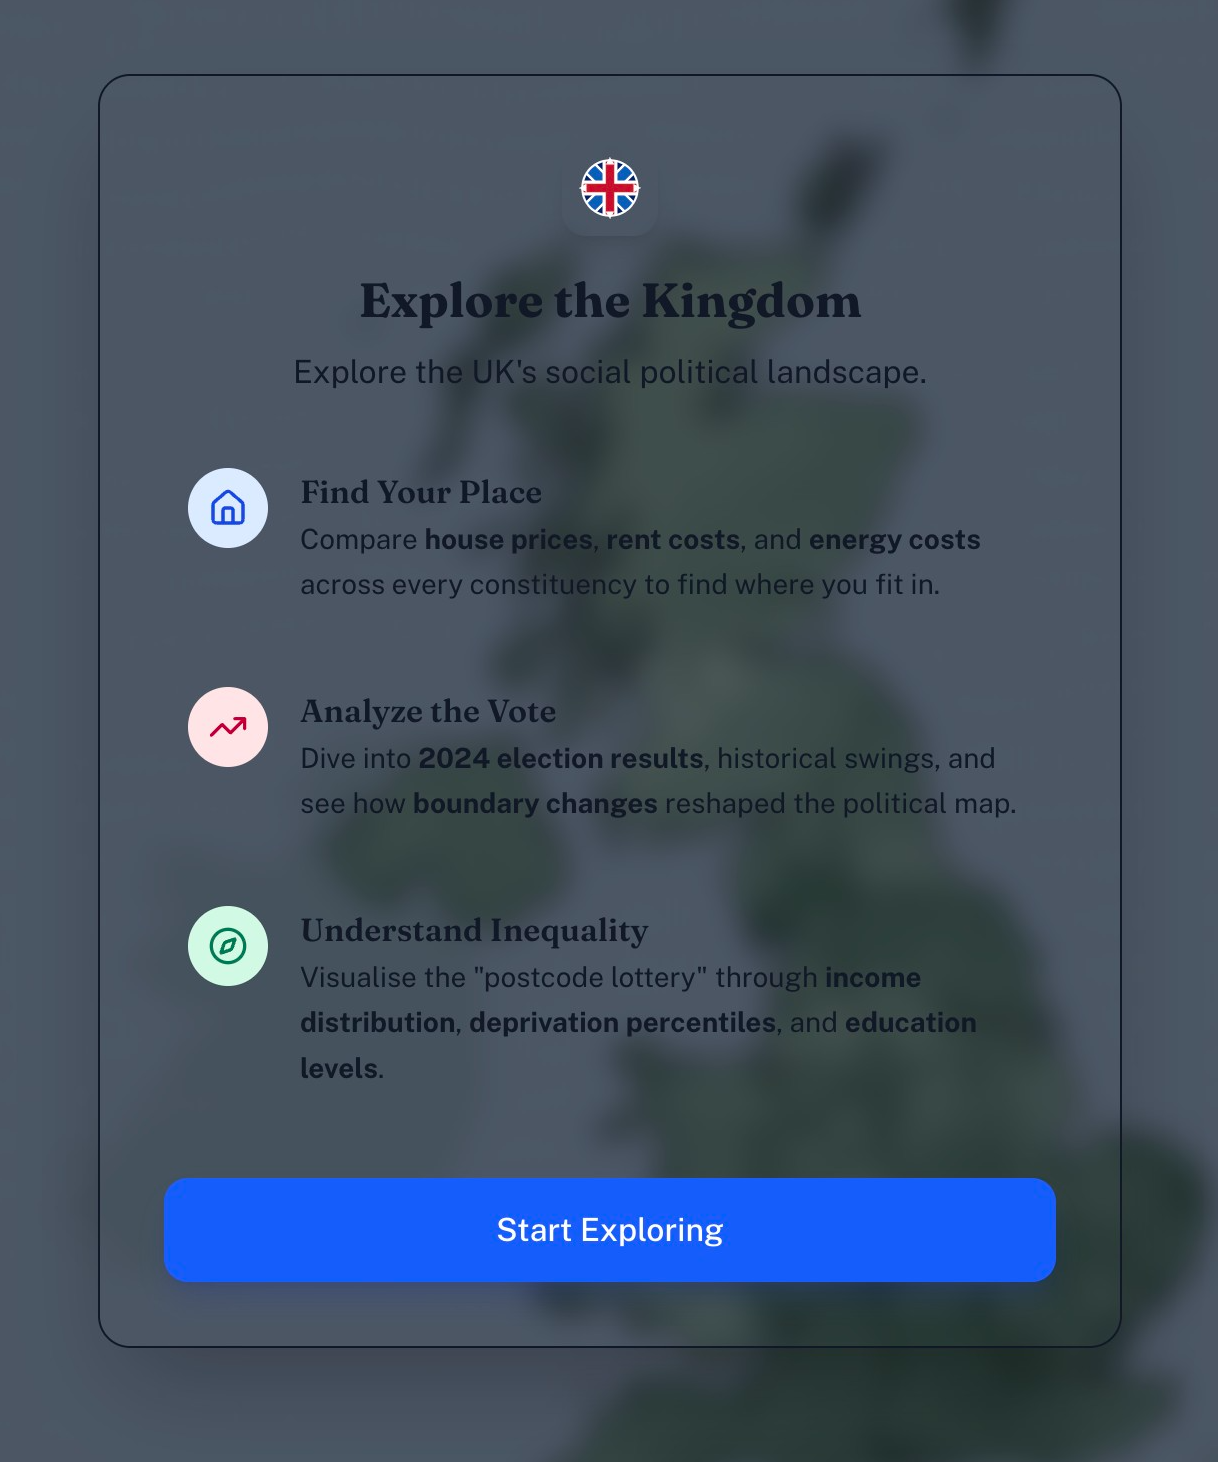
Explore the Kingdom
LondonUK Constituency Data including housing costs, election results, election map boundary changes, and inequality by postcode
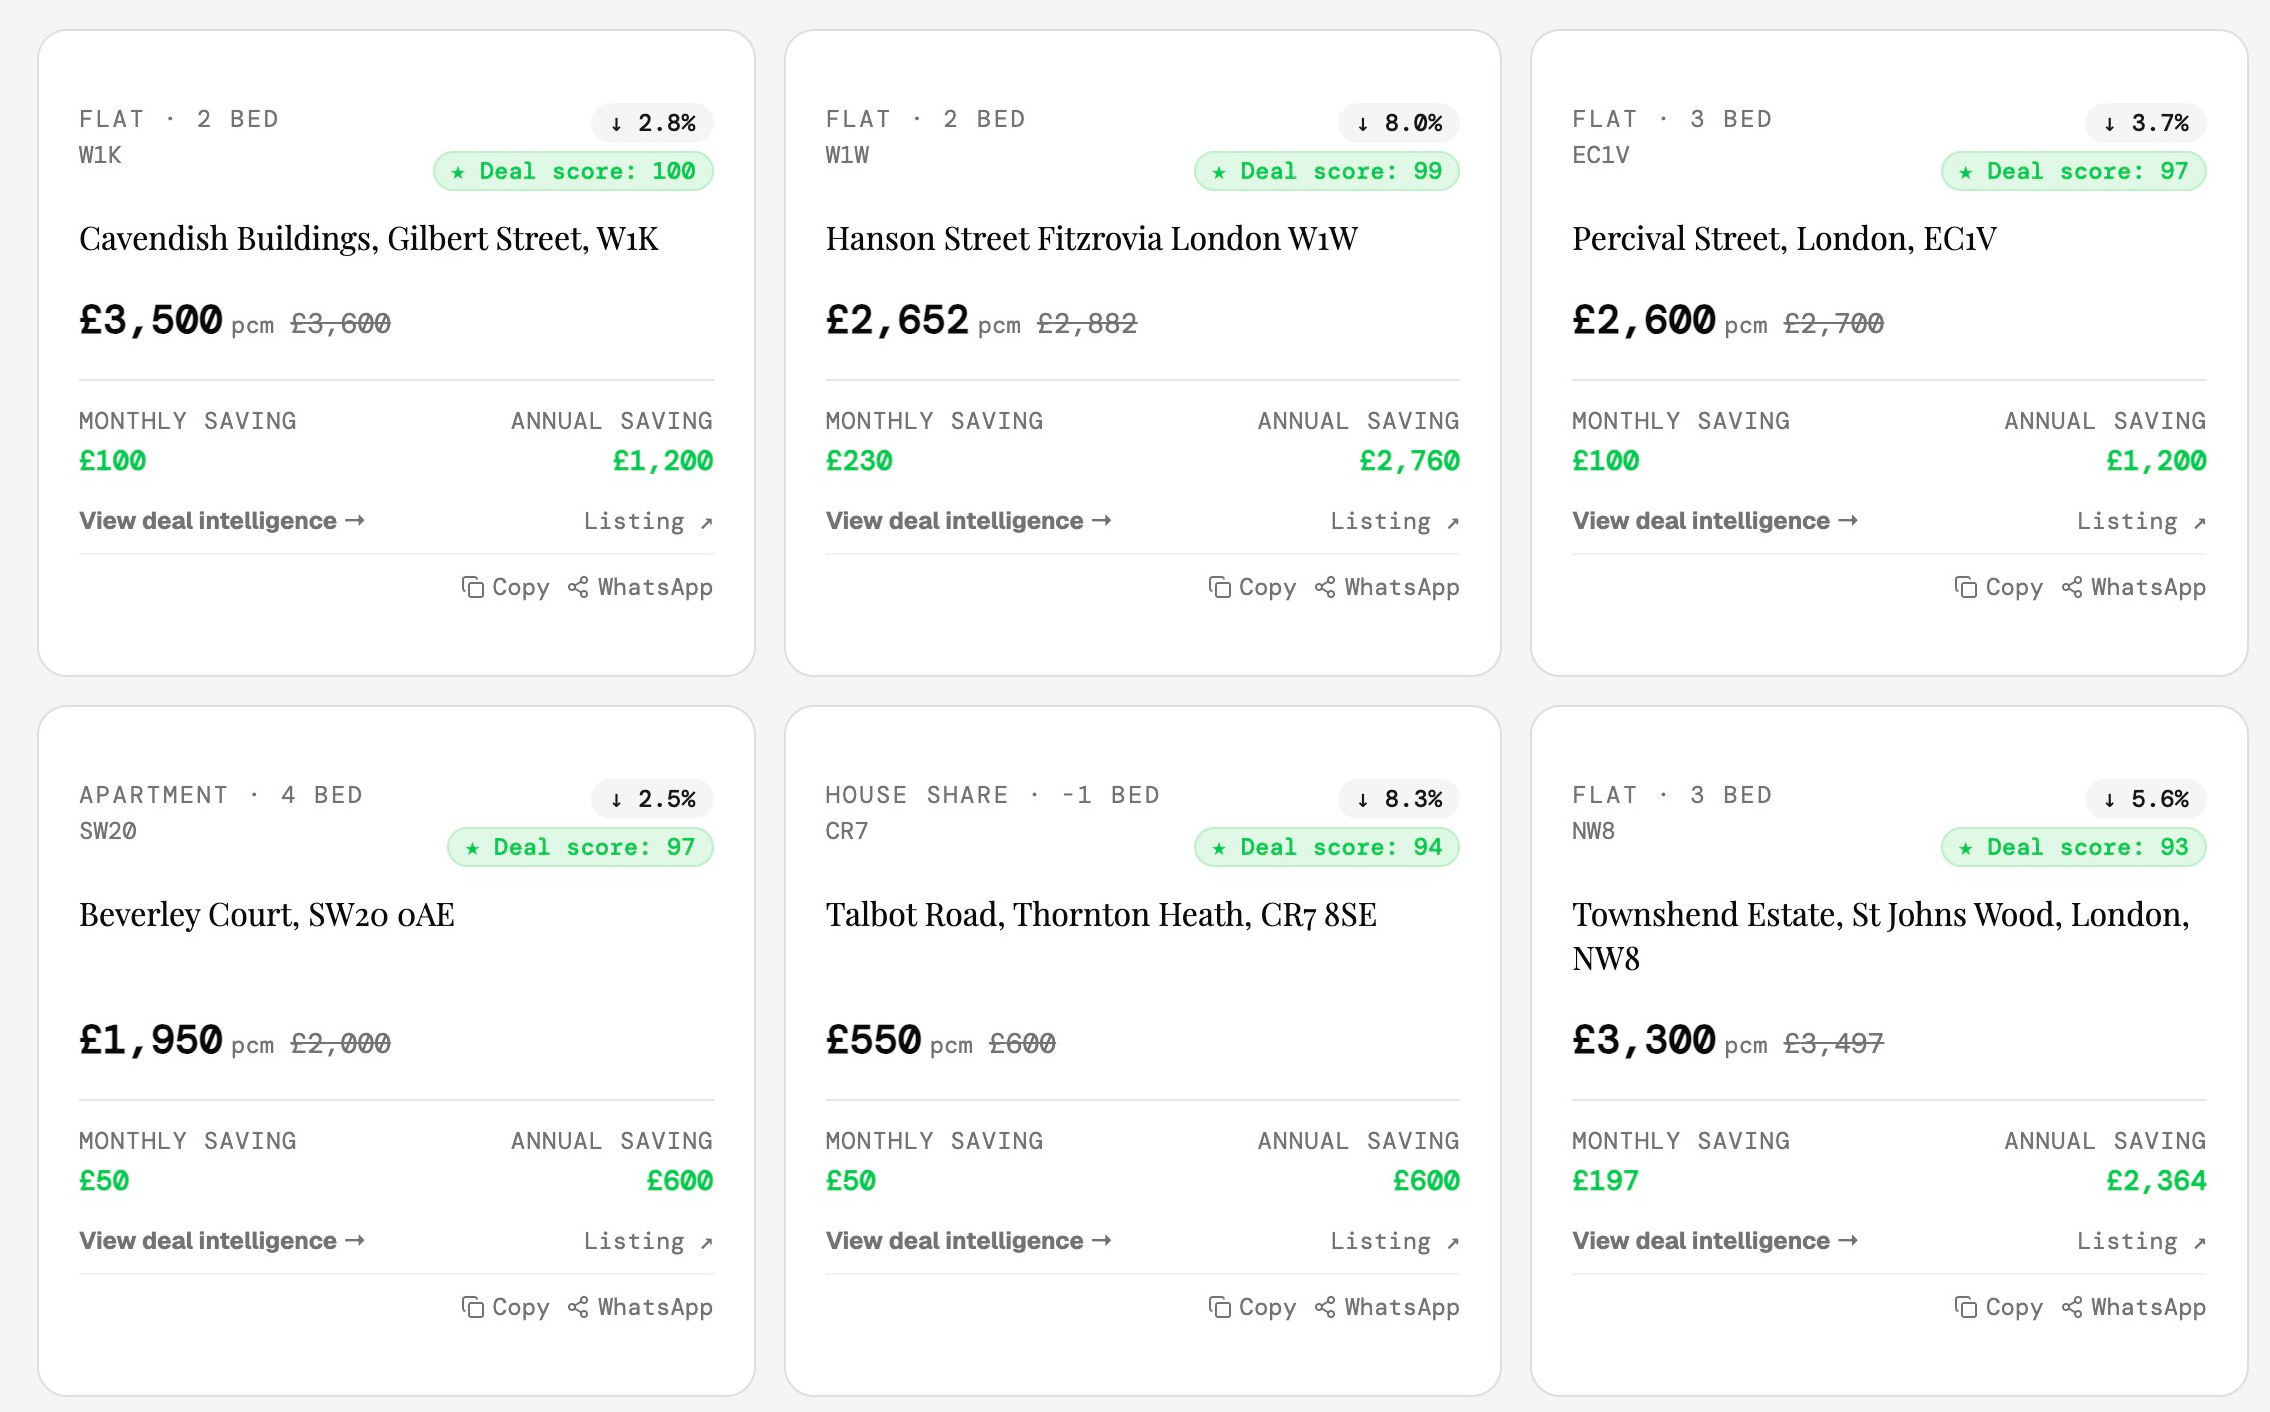
London Rental Price Drops
LondonPaste any Rightmove rental listing URL for instant deal intelligence — market position, negotiation advice, and drop predictions.
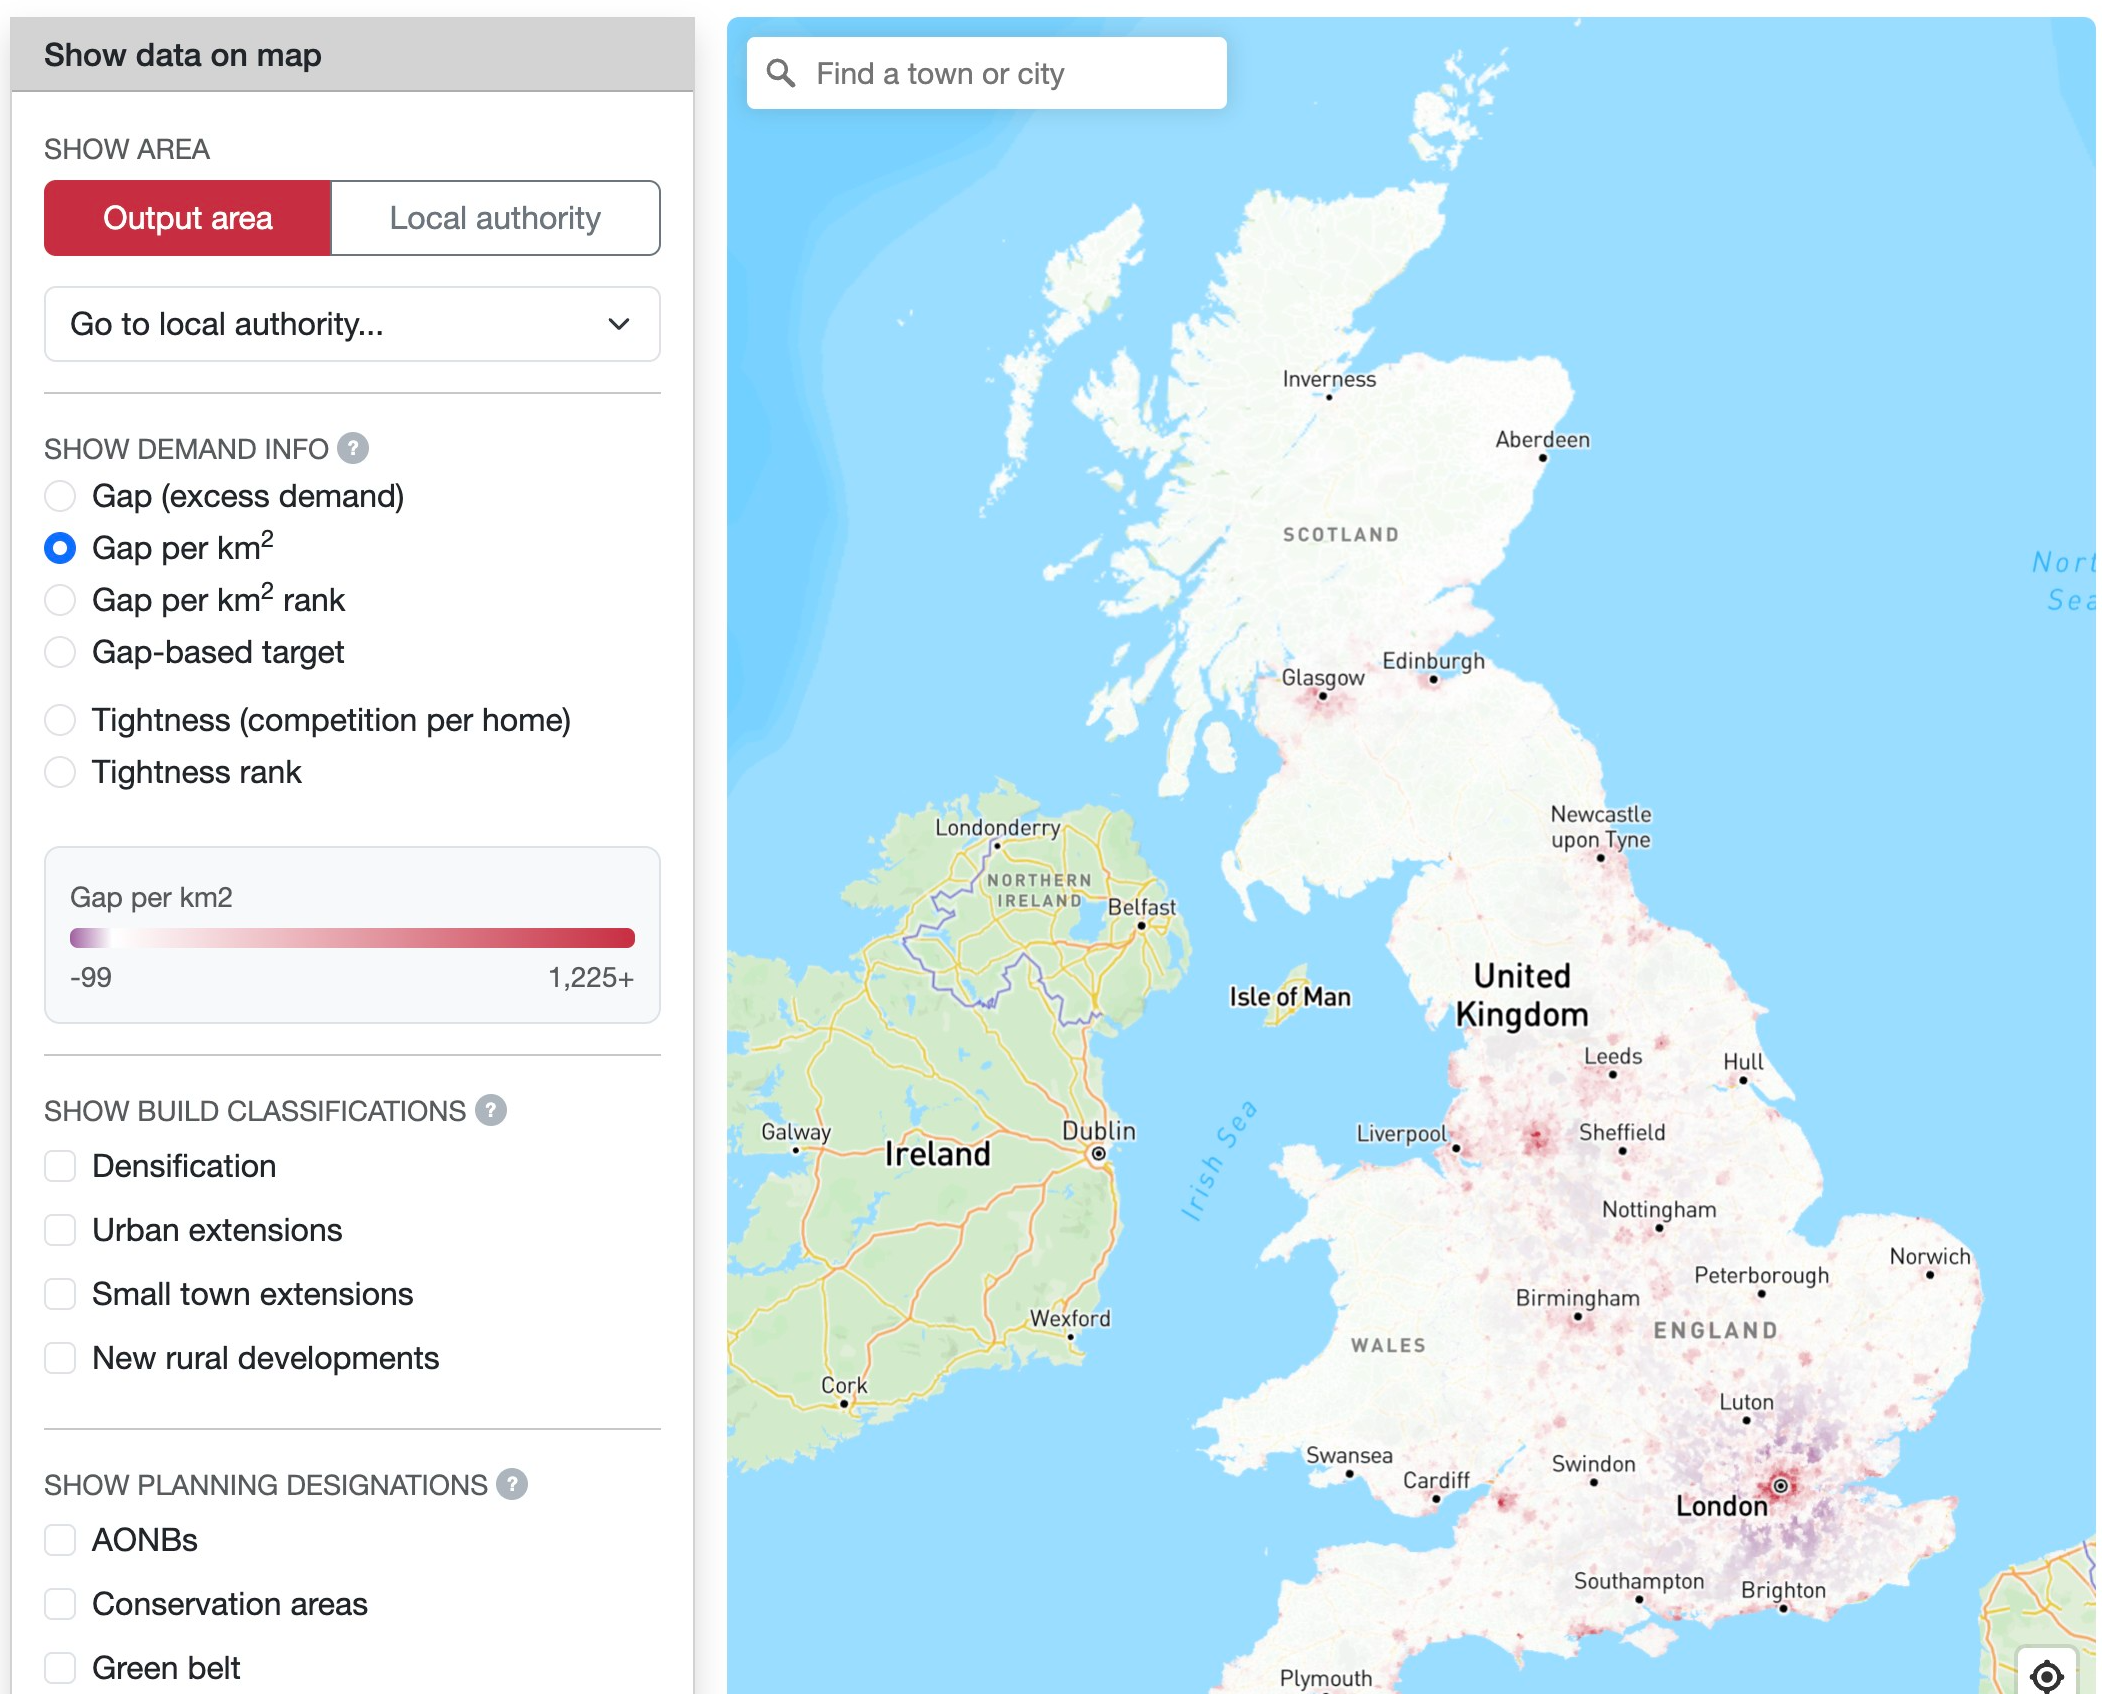
WhereToBuild
University of WarwickThis interactive map is designed to provide evidence on where housing is most needed.

SafeStreets
Chiang MaiFree walkability and pedestrian safety analysis for any street address globally, scoring streets using OpenStreetMap, satellite imagery, and open government data.
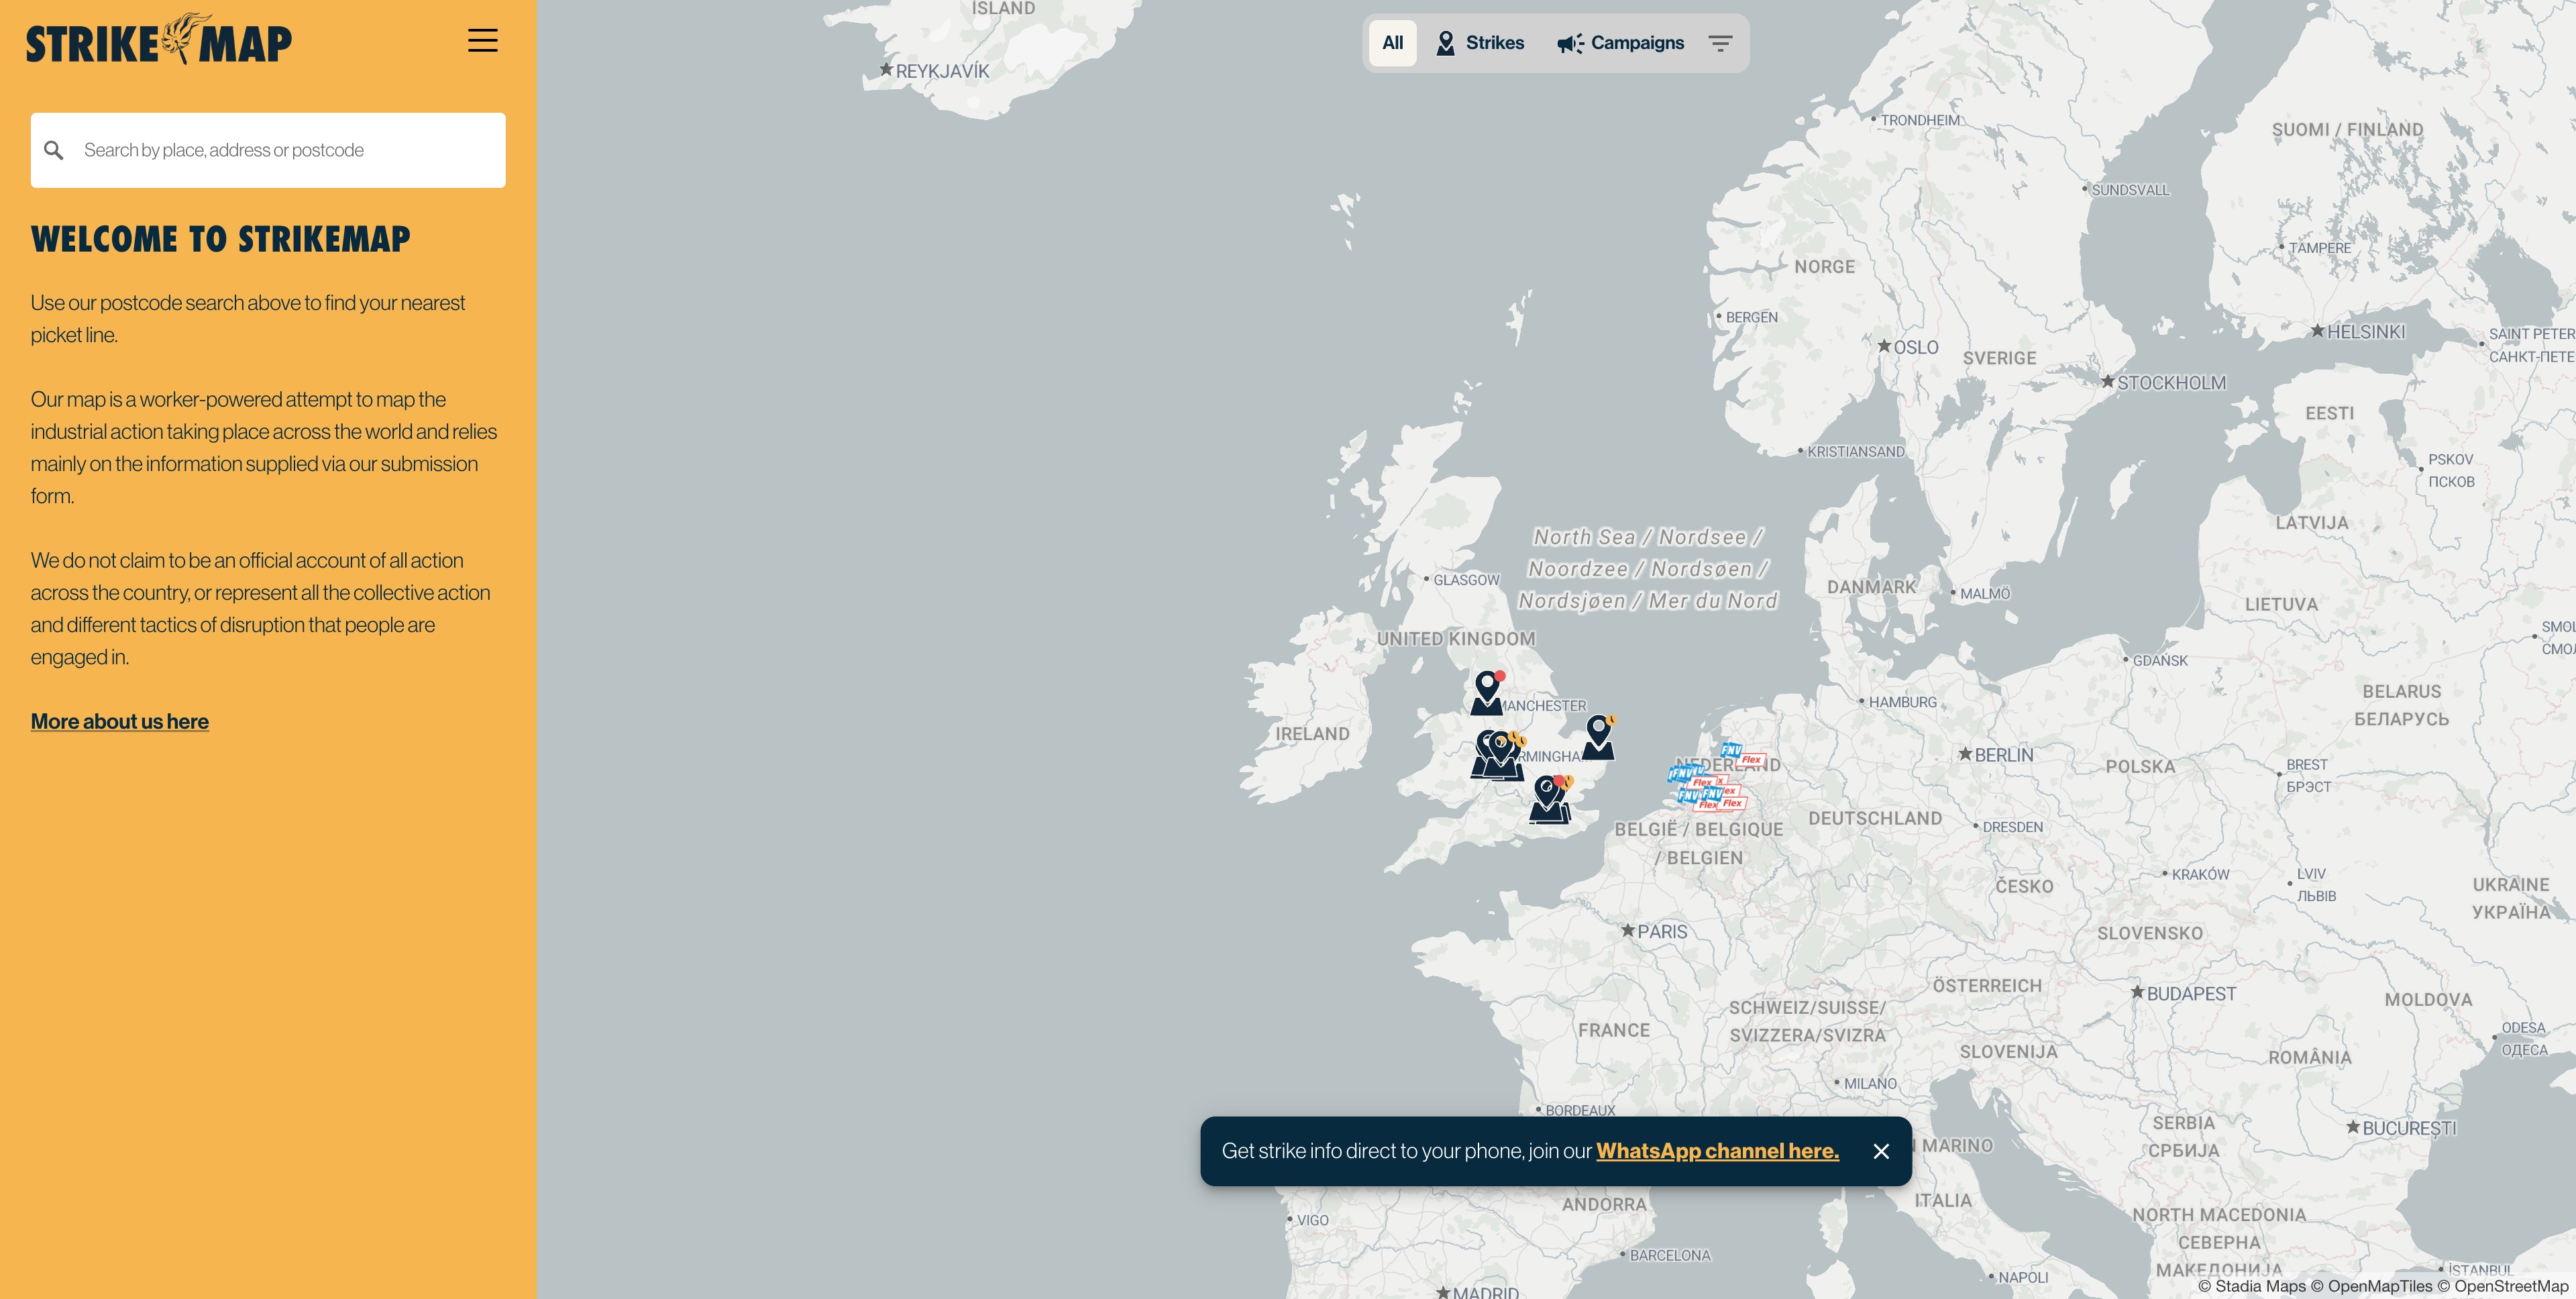
Strike Map
United Kingdom of Great Britain and Northern Ireland 🇬🇧Our map is a worker-powered attempt to map the industrial action taking place across the world and relies mainly on the information supplied via our submission form.
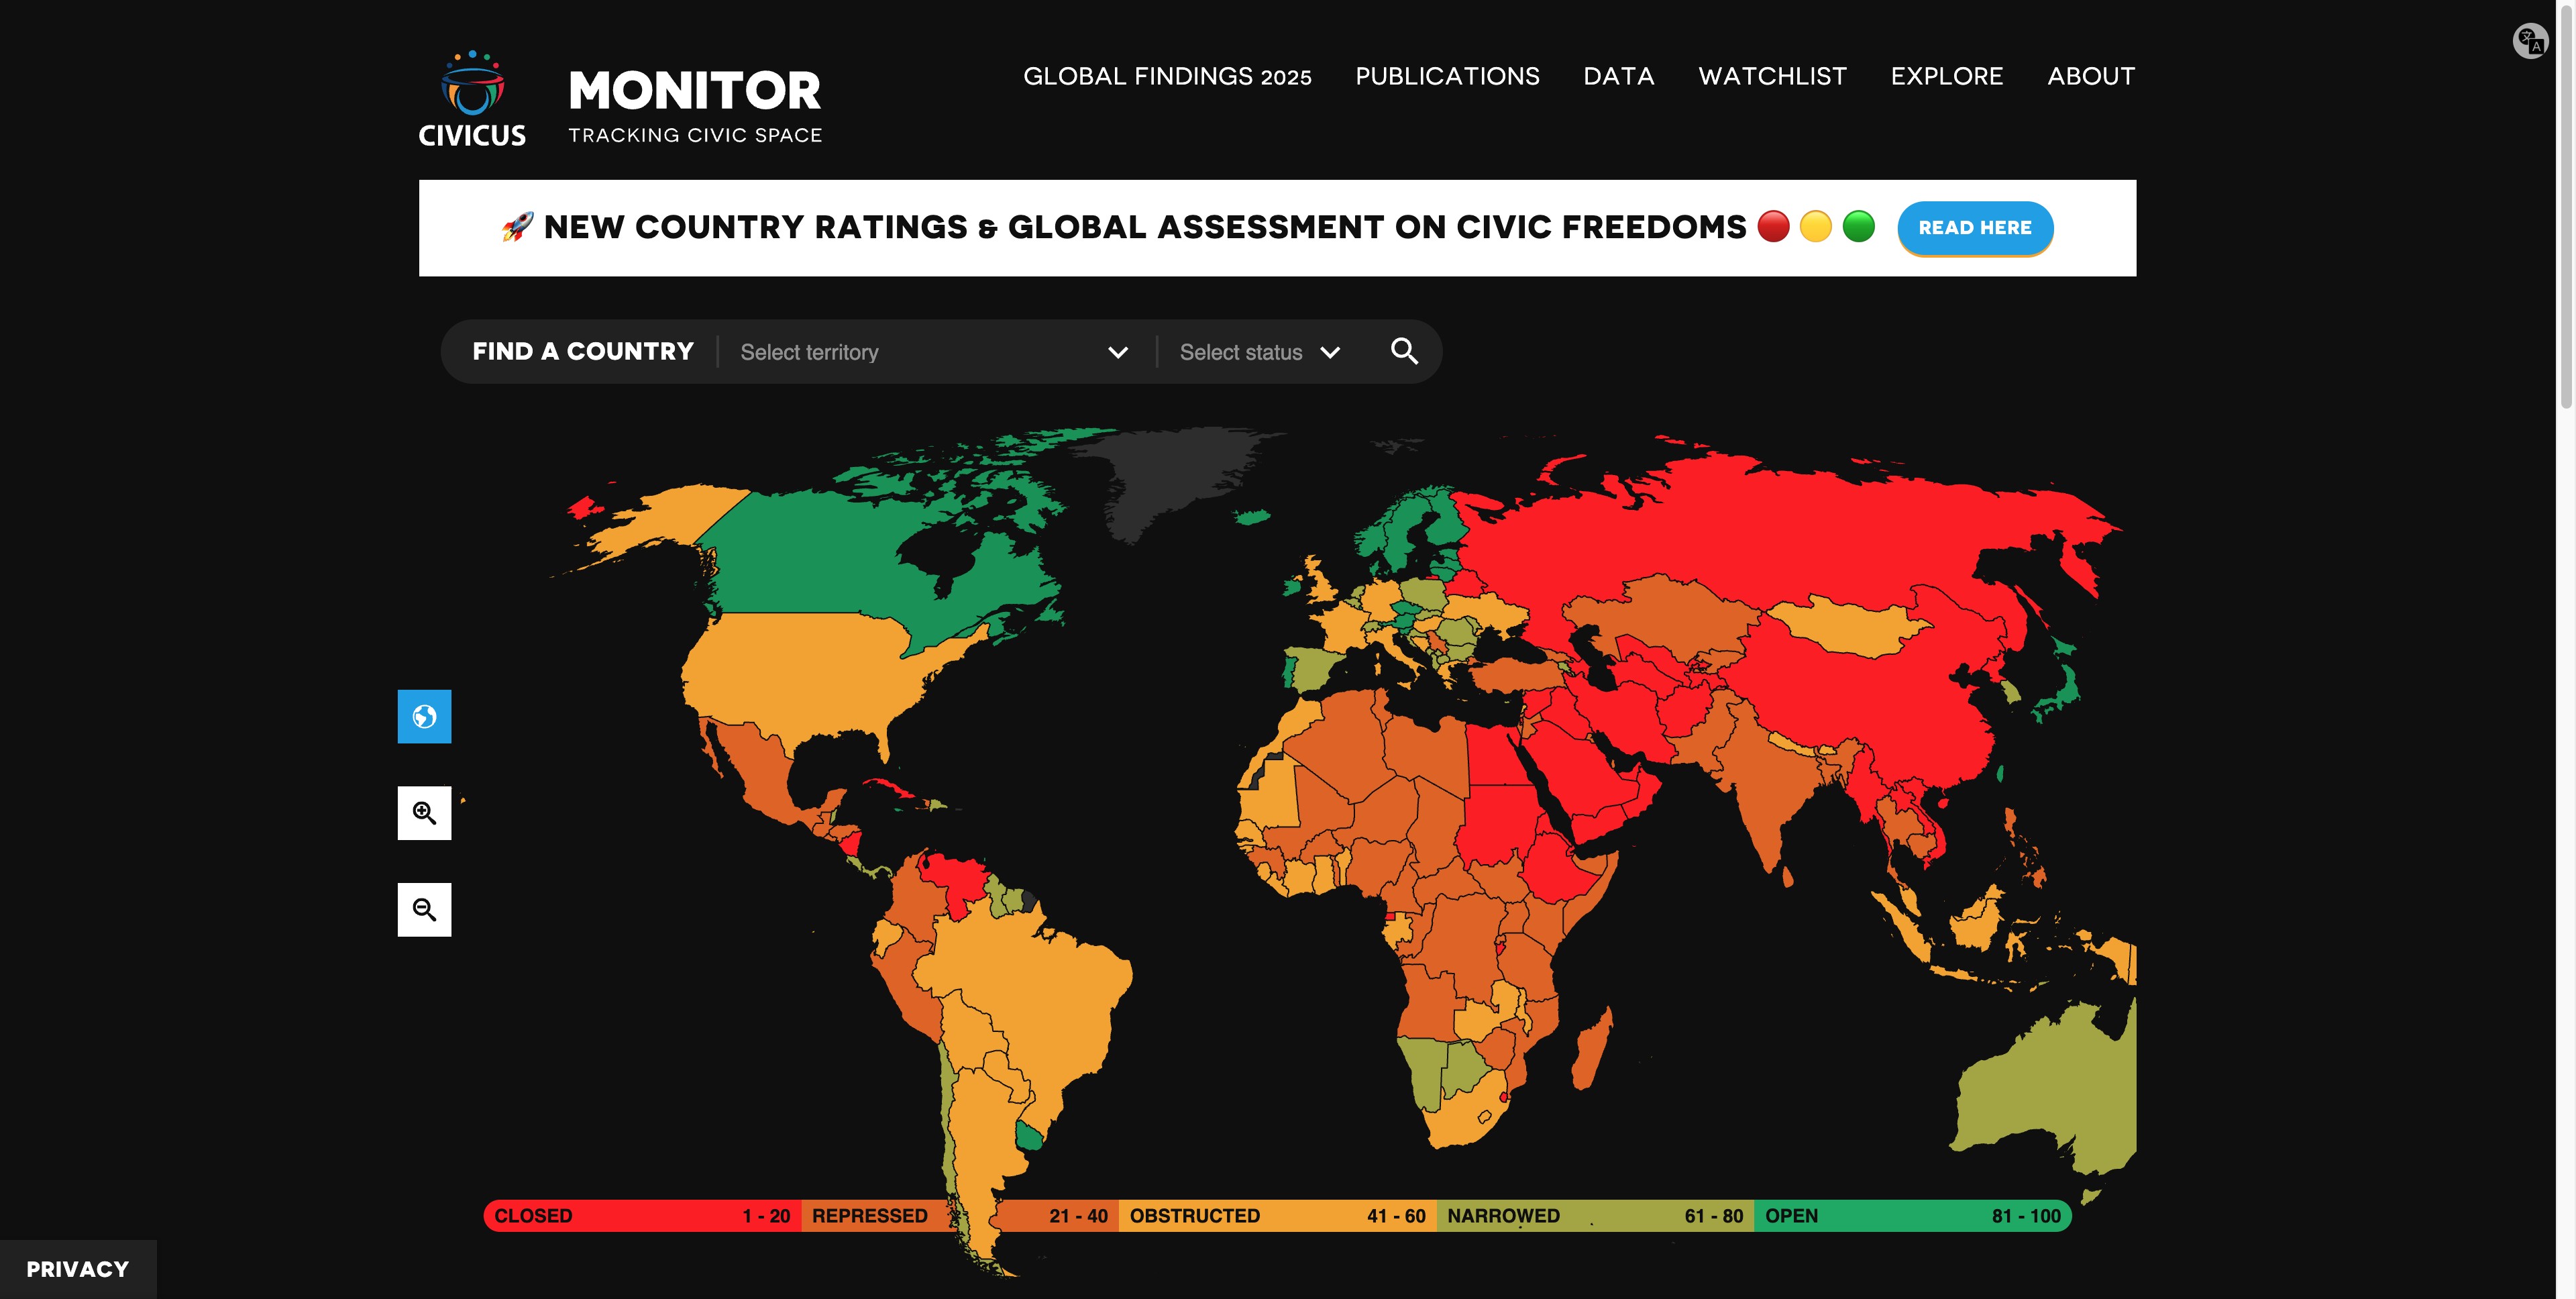
CIVICUS Monitor
JohannesburgOur interactive world map allows you to access live updates from civil society around the world, track threats to civil society and learn about the ways in which our right to participate is being realised or challenged.
Live Journalism Map
MaastrichtThe map features initiatives that combine journalistic practice with live, in-person engagement: performances, assemblies, or participatory events that are based on factual storytelling or original reporting.
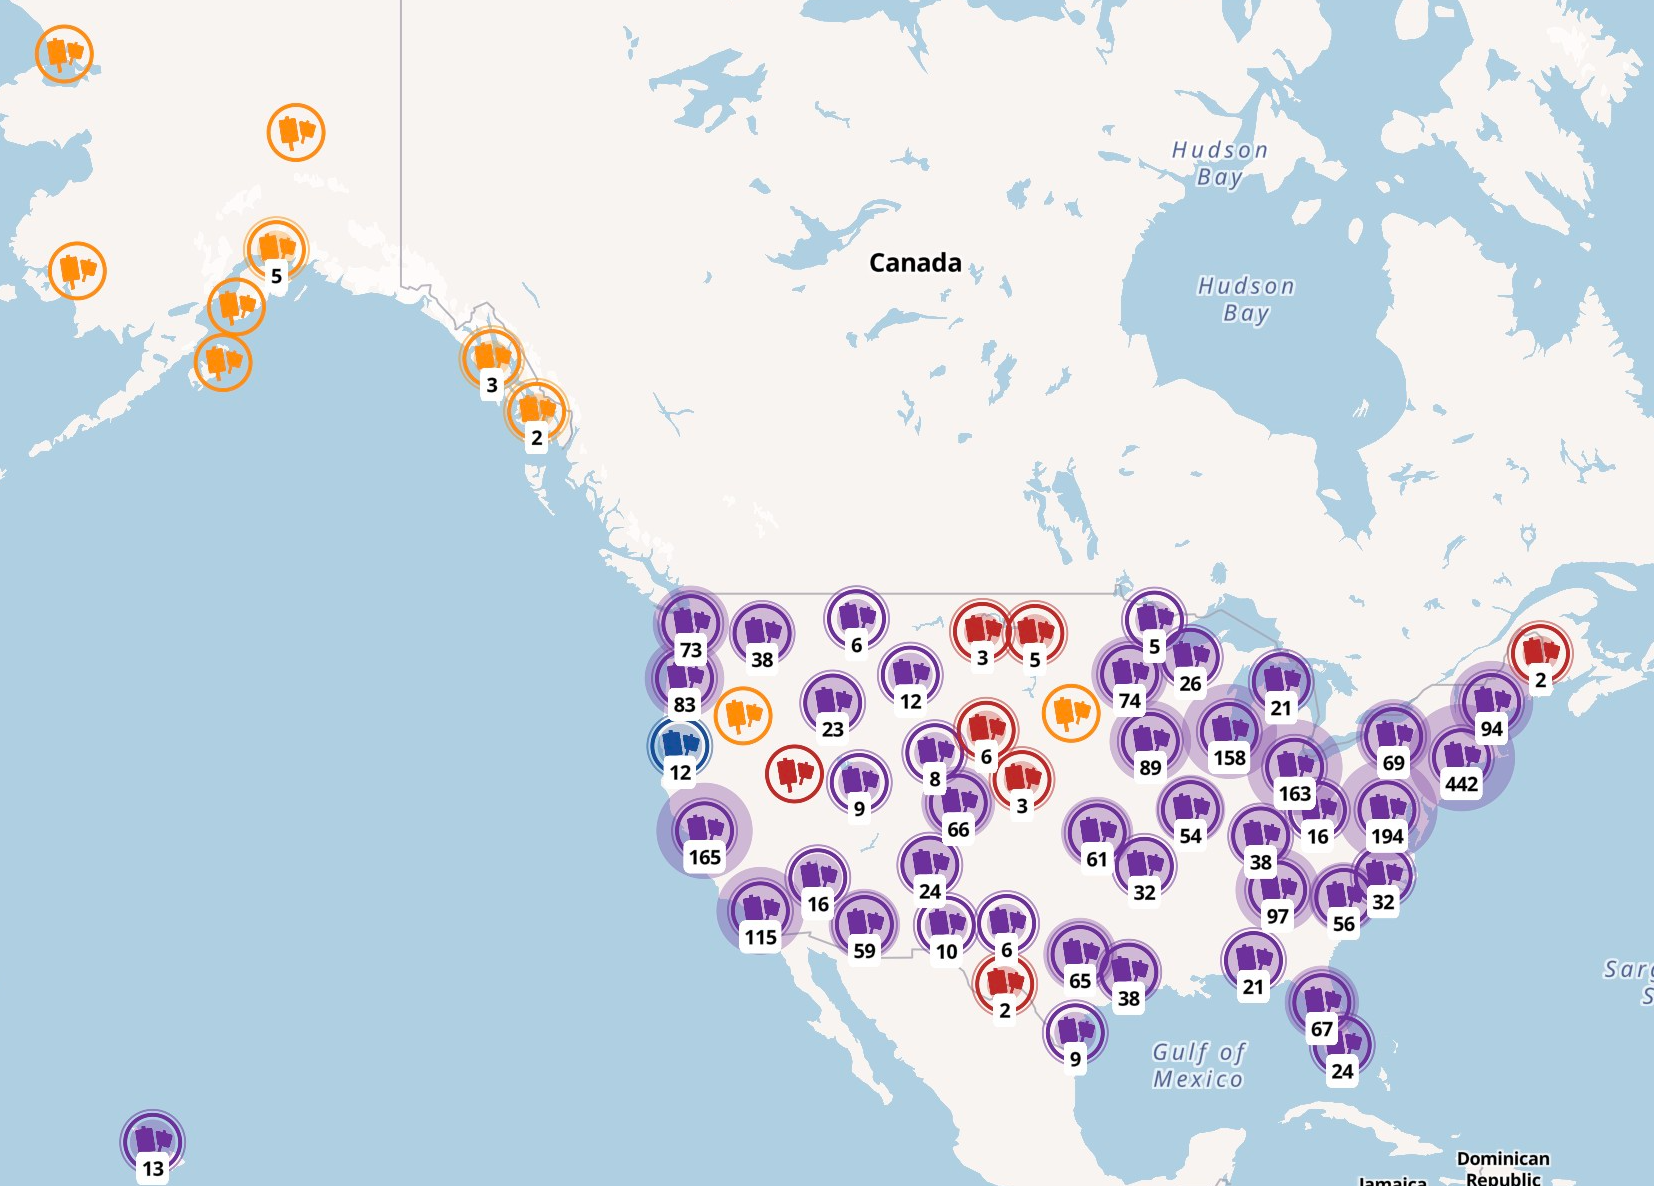
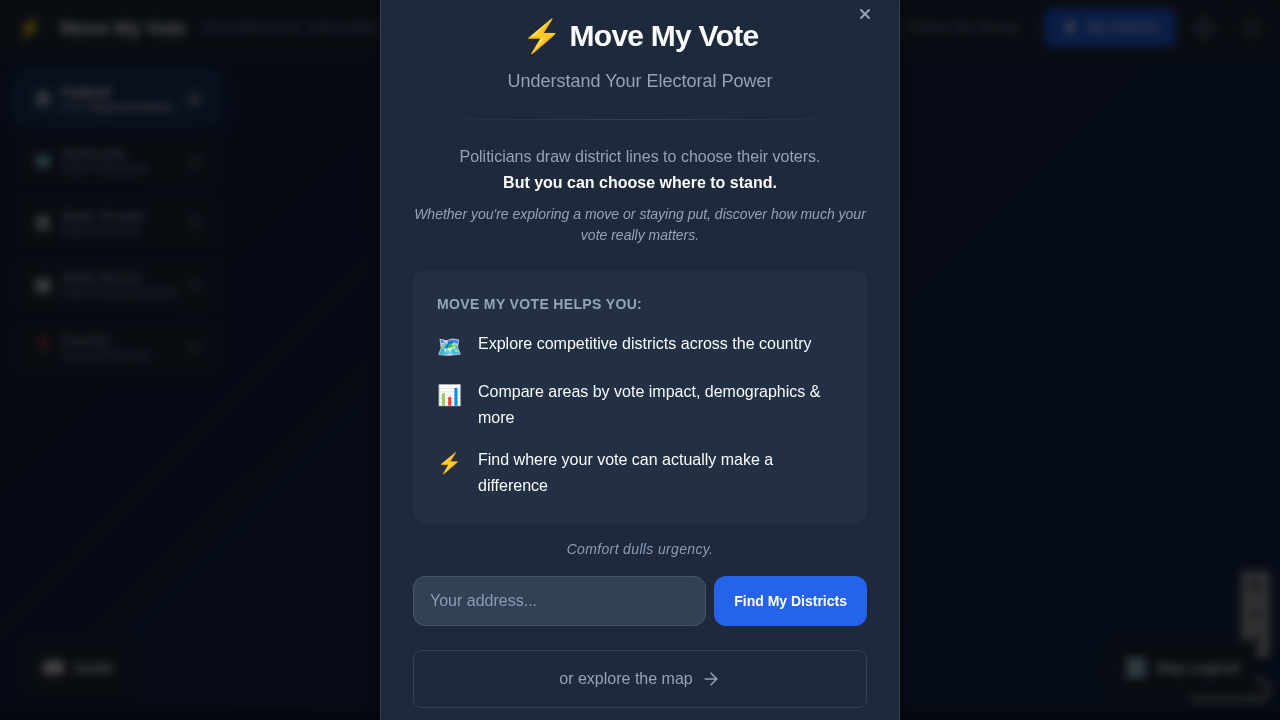
Protests in the US
United States of America 🇺🇸Map of No Kings protests, color-coded by how each location voted in 2024
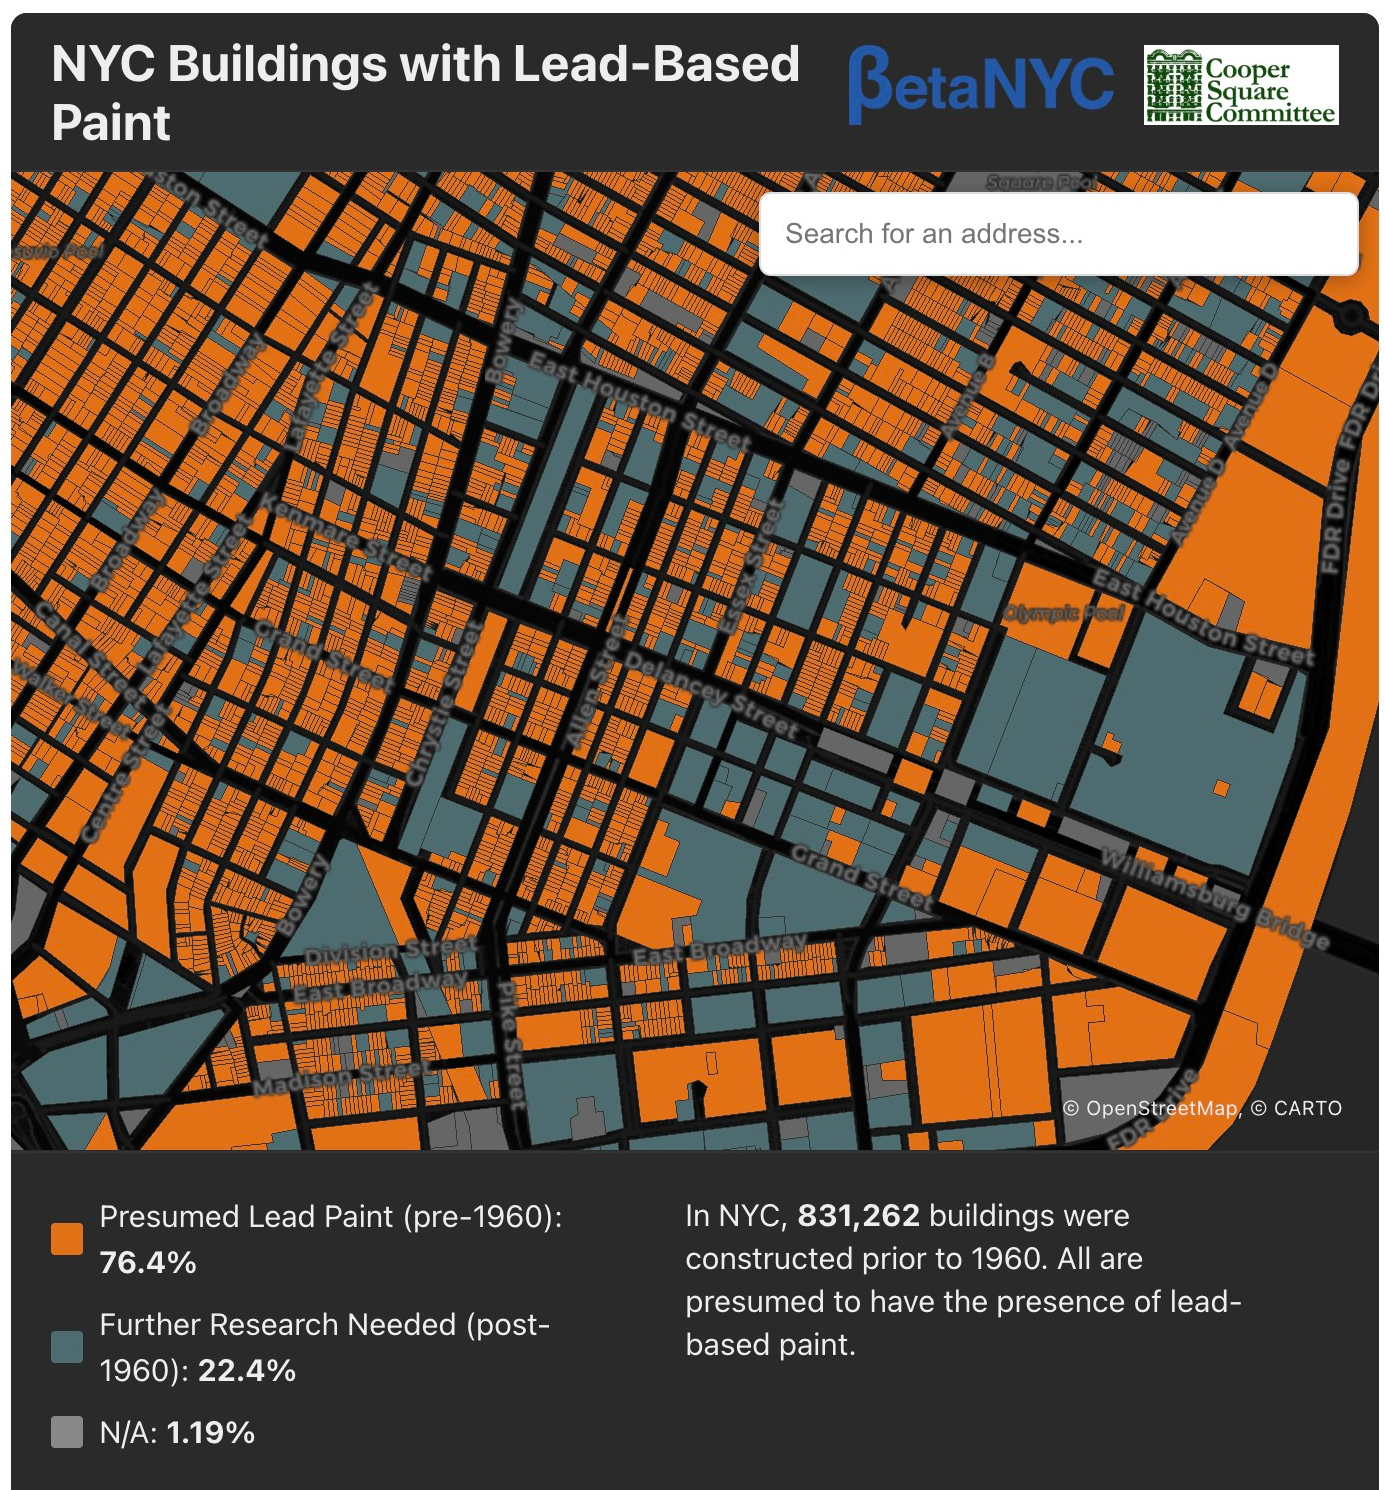
Does Your Home Contain Lead Paint?
New York City (NYC / New York, NY)Map of NYC buildings with lead-based paint

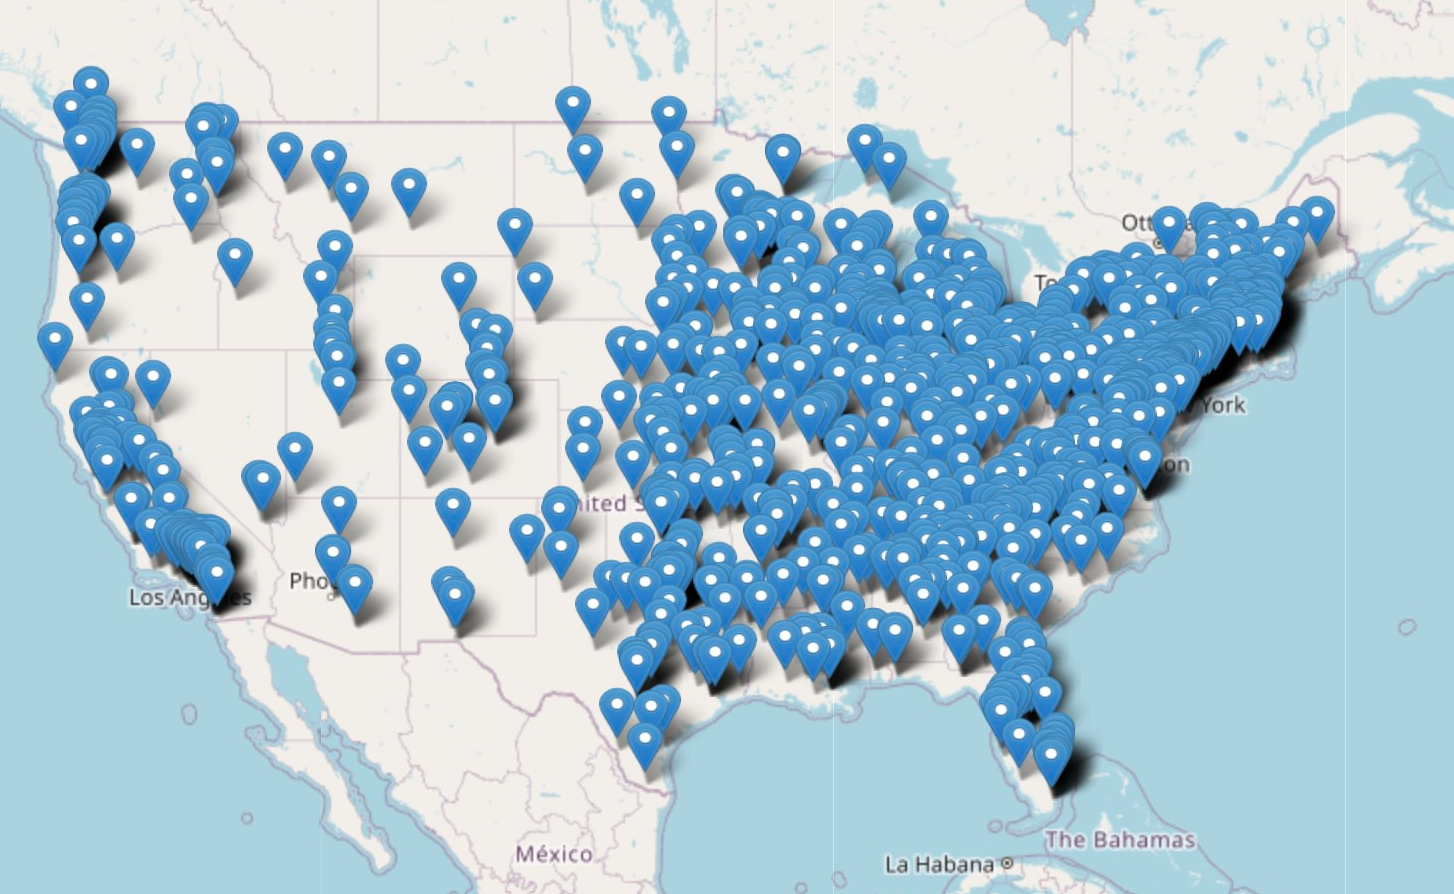
icemap.dev aims to provide a comprehensive view of the activities of America's Immigration Customs Agency (ICE), with specific focus on its Enforcement and Removal Operations department (ERO).

ByMapka
Belarus (Bielaruś / Беларусь / Belarus / Беларусь) 🇧🇾ByMapka is a platform that unites Belarusian diasporas and their businesses around the world.
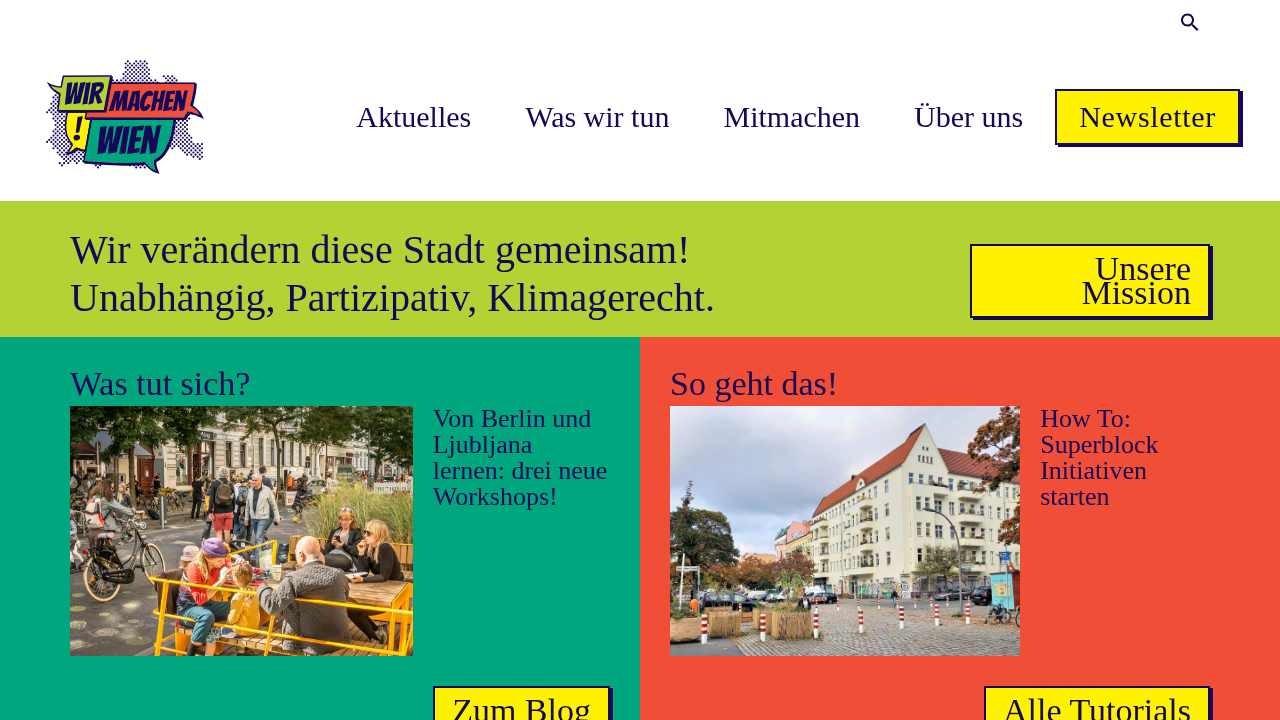
#WirMachenWien
ViennaWir setzen uns unabhängig von Parteistrukturen für konkrete Umgestaltung, Aufwertung oder Erhalt von öffentlichem Raum in Wien im Sinne von Klimaschutz, Gesundheit, aktiver Mobilität, Begrünung, Lebensqualität und Verkehrsberuhigung ein.
Mapa Polskich Drzew
Poland (Polska) 🇵🇱The "Map of Polish Trees" is a nationwide, social project aimed at creating an inventory of trees growing across Poland.
The Under the Surface project, coordinated by Arena for Journalism in Europe and initiated by Datadista, delved into official data from European countries to reveal, for the first time, the extent of the danger we face.
Благодійний фонд "DeepStateUA"
Ukraine (Ukrayina) 🇺🇦

DeepStateMAP | День 1297
Ukraine (Ukrayina) 🇺🇦Ukrainian government map of the war in Ukraine
Tool to Reflect Overall Voter Engagement (TROVE)
Lincoln, NECivic Nebraska's Tool to Reflect Overall Voter Engagement represents the total number of ballots cast out of the total number of registered Nebraska voters in the general election.
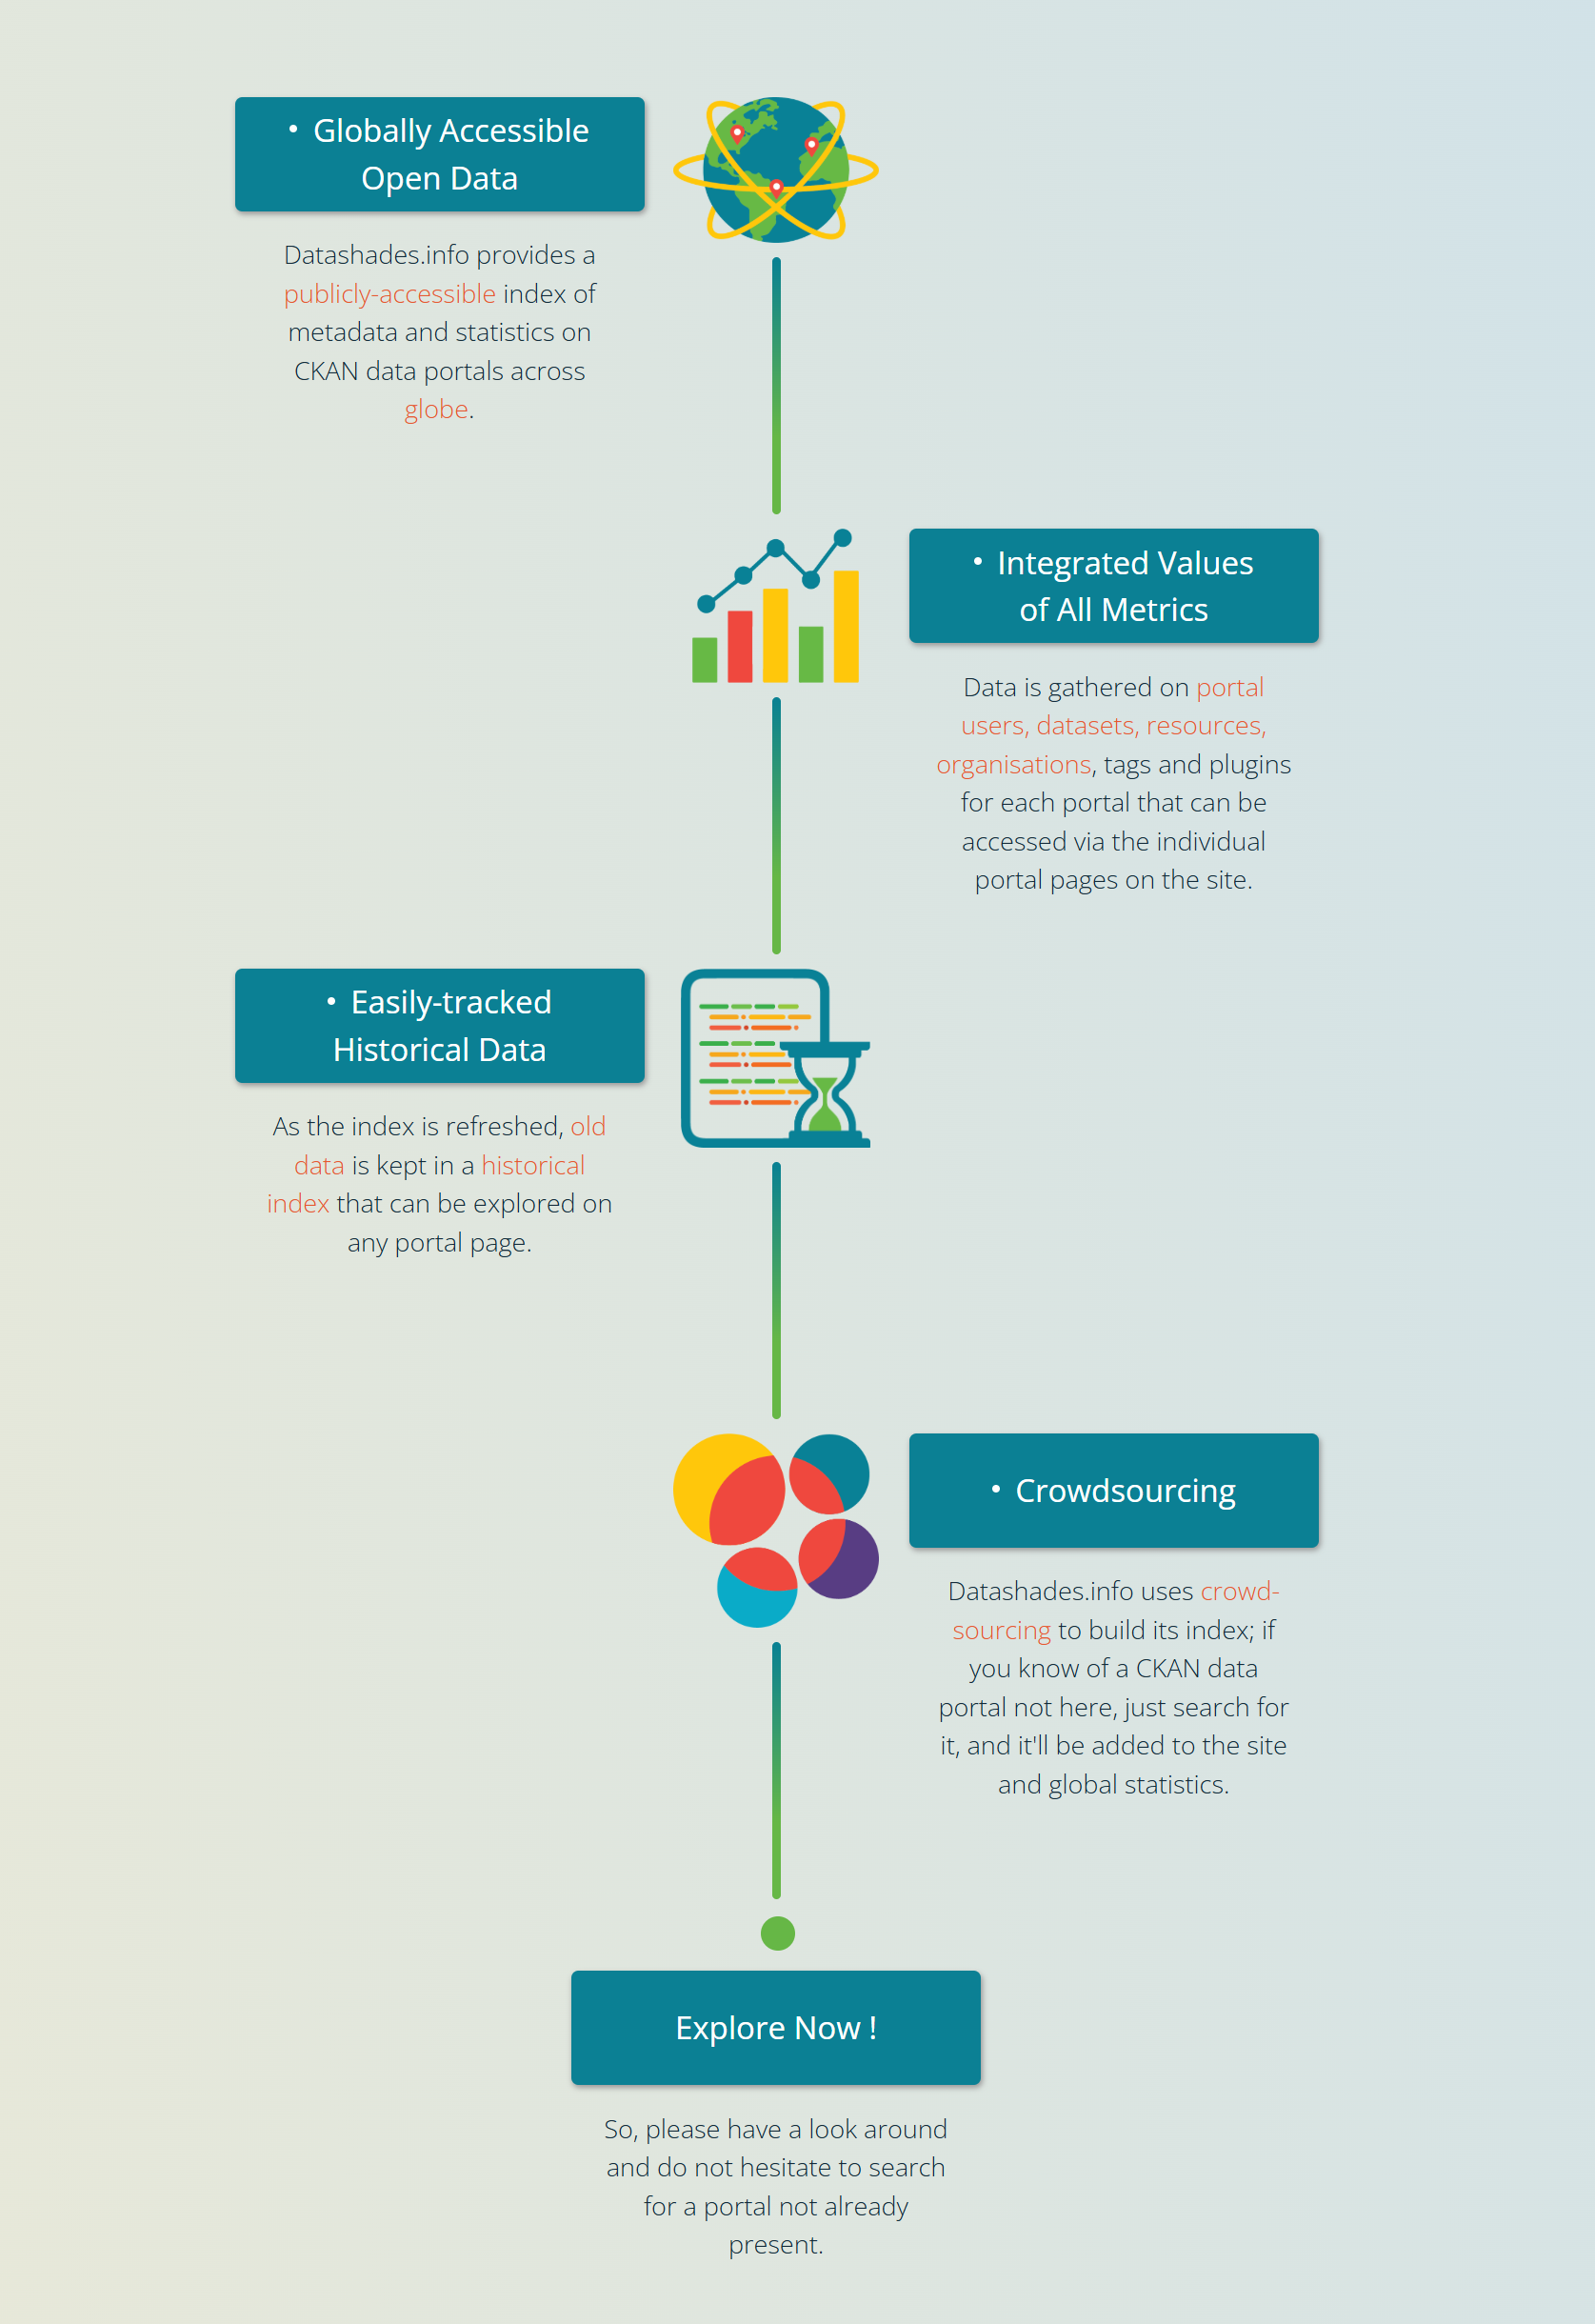
Datashades.Info
Australia 🇦🇺Datashades.info is a comprehensive search hub and discovery tool for the global CKAN community, designed to enhance the accessibility and usability of open data.
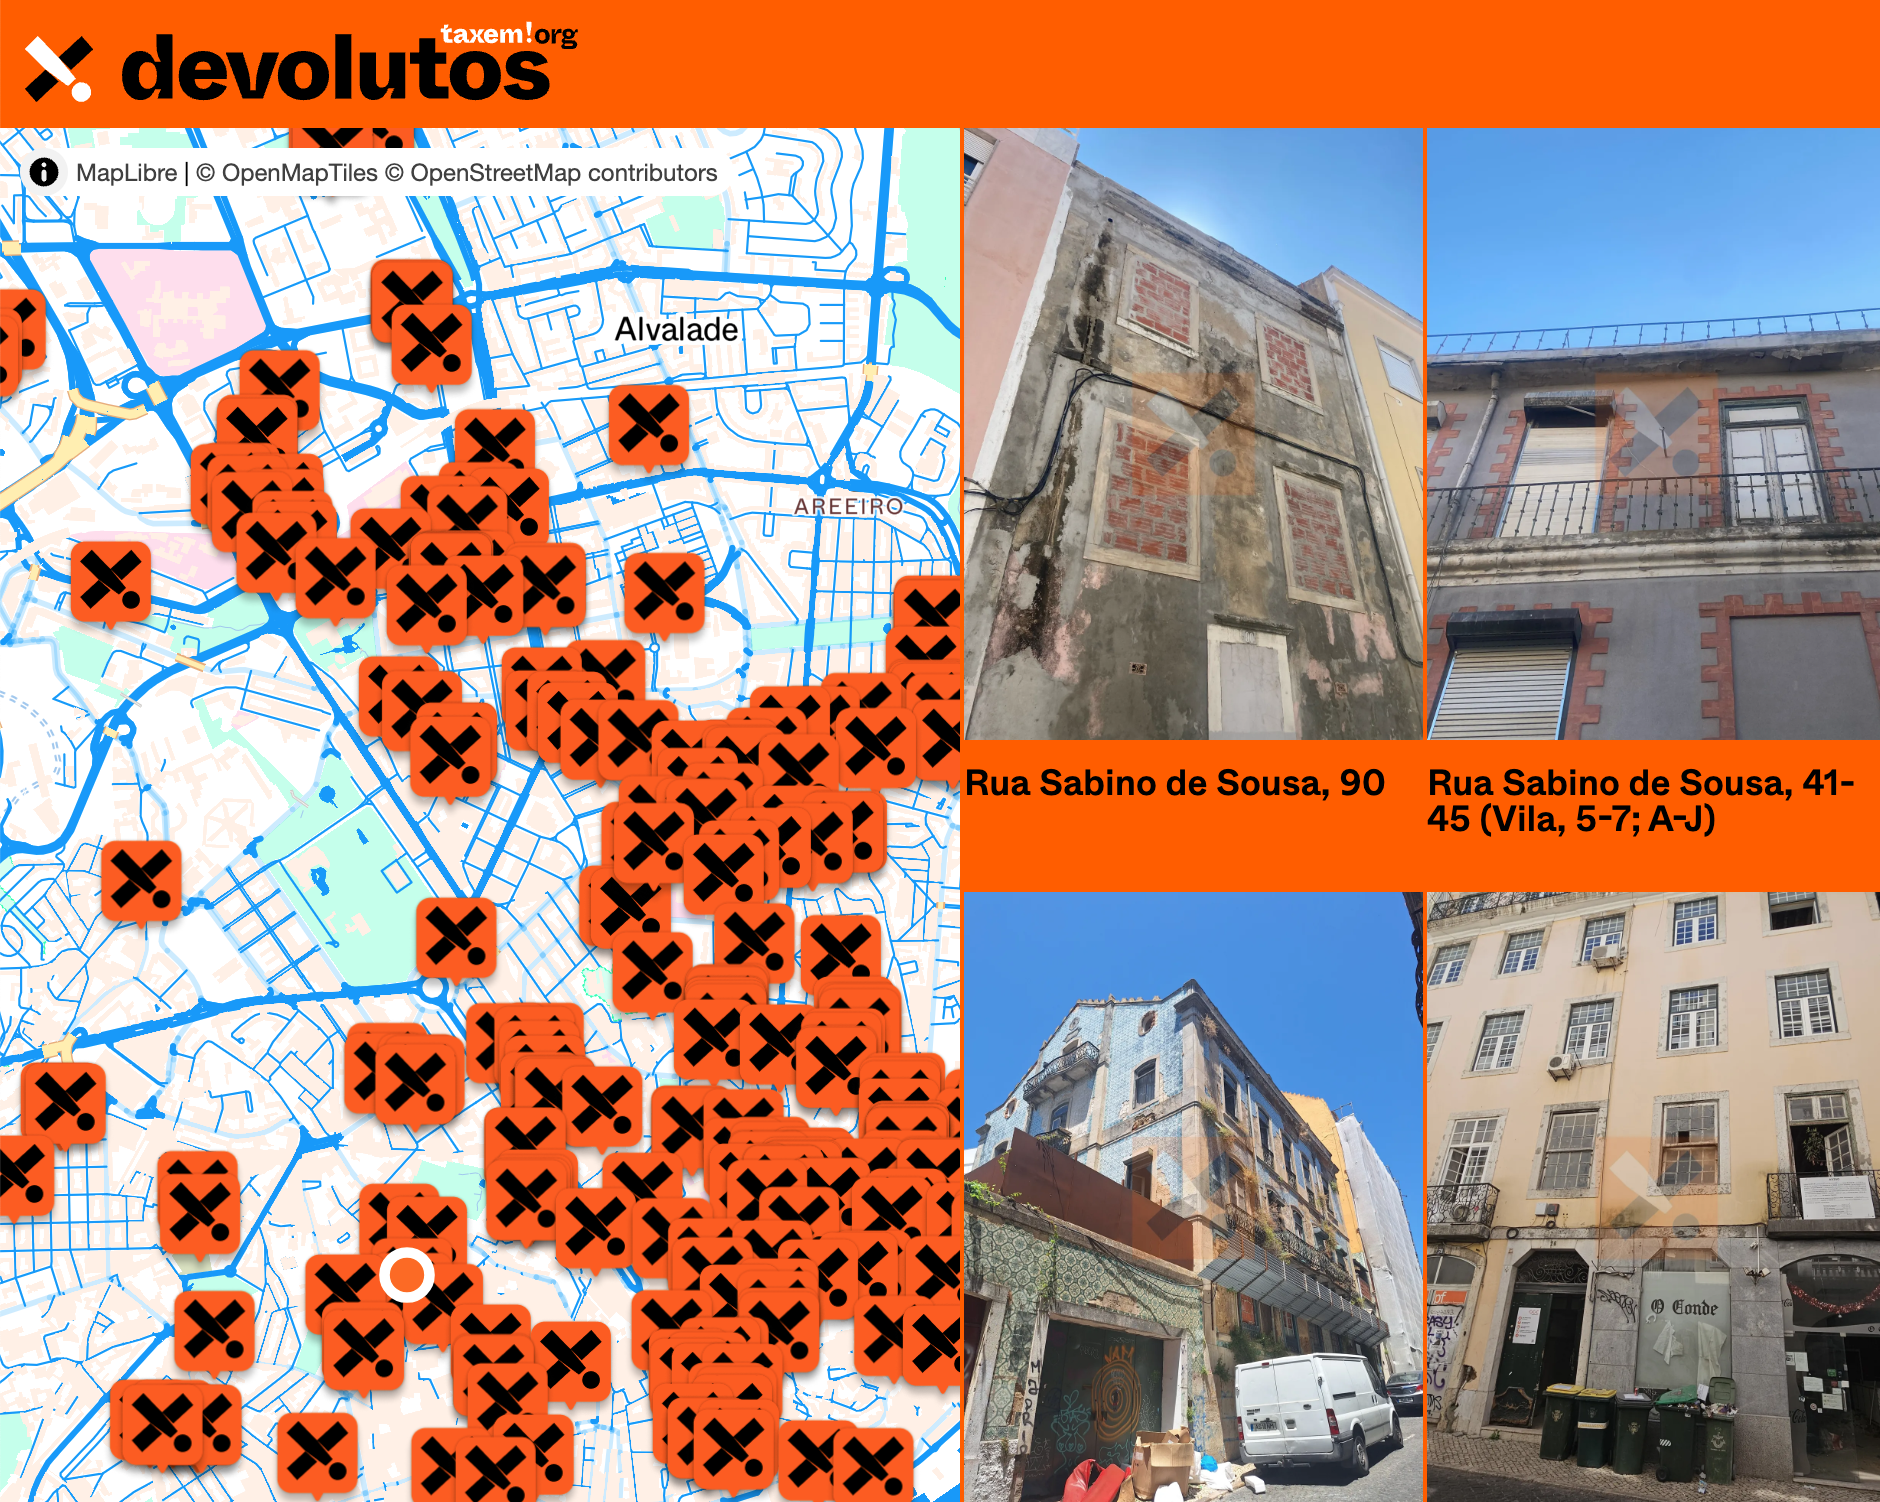
Devolutos
LisbonDevolutos is a pro-bono project built by a collective of activists to map Lisbon's empty housing and encourage the government to tax their owners to prompt redevelopment.
+(1).png)
Boston Curb Usage Map
BostonTo solve these challenges, the Streets Cabinet and Innovation and Technology Cabinet are building a digital map of Boston’s complex curb network and regulations.

RefAid
United Kingdom of Great Britain and Northern Ireland 🇬🇧The app seeks to ensure that migrants in Europe can access trusted services and accurate information in the palm of their hand - wherever they are.

Herstory in East Asia
South Korea (Republic of) (Hanguk or Namhan) 🇰🇷We want to show "herstory" in East Asia from local perspectives with a timeline and a map in our local languages, so that people from different regions of East Asia can learn more about the stories and rights women and LGBETQ+ have fought for.

Sakepedia and Code for SAKE
Japan (Nihon or Nippon) 🇯🇵Crowdsourced project to collect data on sake and sake breweries from across Japan, integrates lost historical data, and utilizes digital technology to establish stronger connections between producers and consumers.

BKK Follow Up
BangkokA 12-year retrospective of problems that have bothered Bangkok residents | สำรวจปัญหากวนใจชาว กทม.

Disfactory
TaipeiCrowdsourced reporting on Illegal Factories on Farmland in Taiwan

FloodGen
New York City (NYC / New York, NY)A flood advocacy tool that uses generative AI to visualize photorealistic images of potential flood scenarios

Miami Affordability Project (MAP)
Miami, FLThe Miami Affordability Project (MAP) is an interactive online map providing data on the distribution of affordable housing, housing needs, demographic profiles, and environmental resiliency in greater Miami.
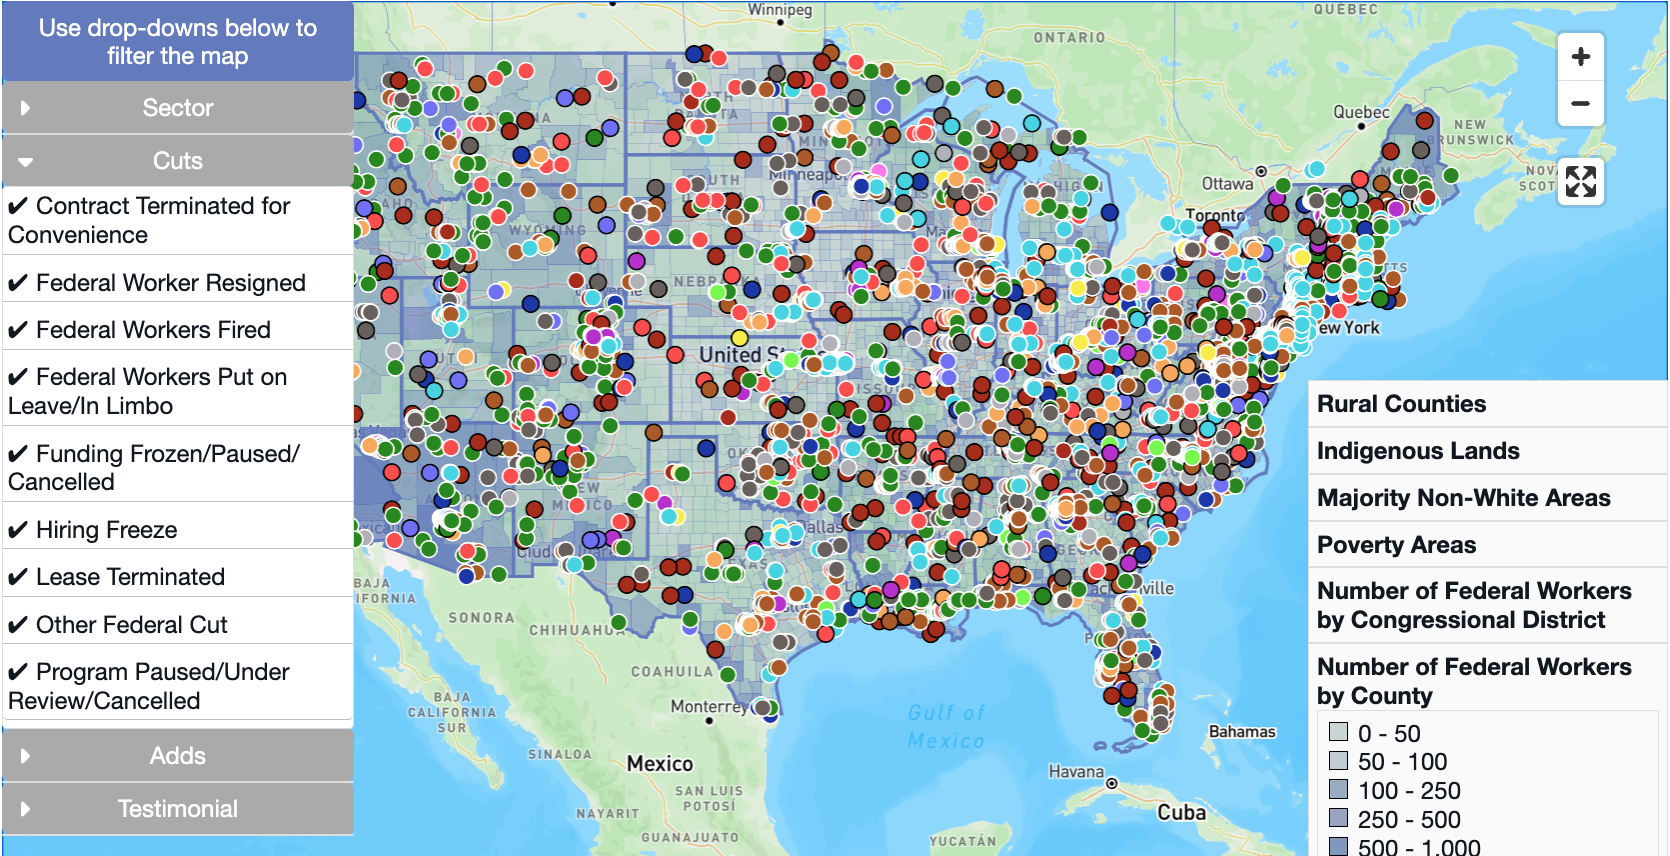
DOGE Cuts by City, State, and Congressional District
United States of America 🇺🇸Find out how the Trump administration’s DOGE cuts to grants and federal real estate are affecting your community.
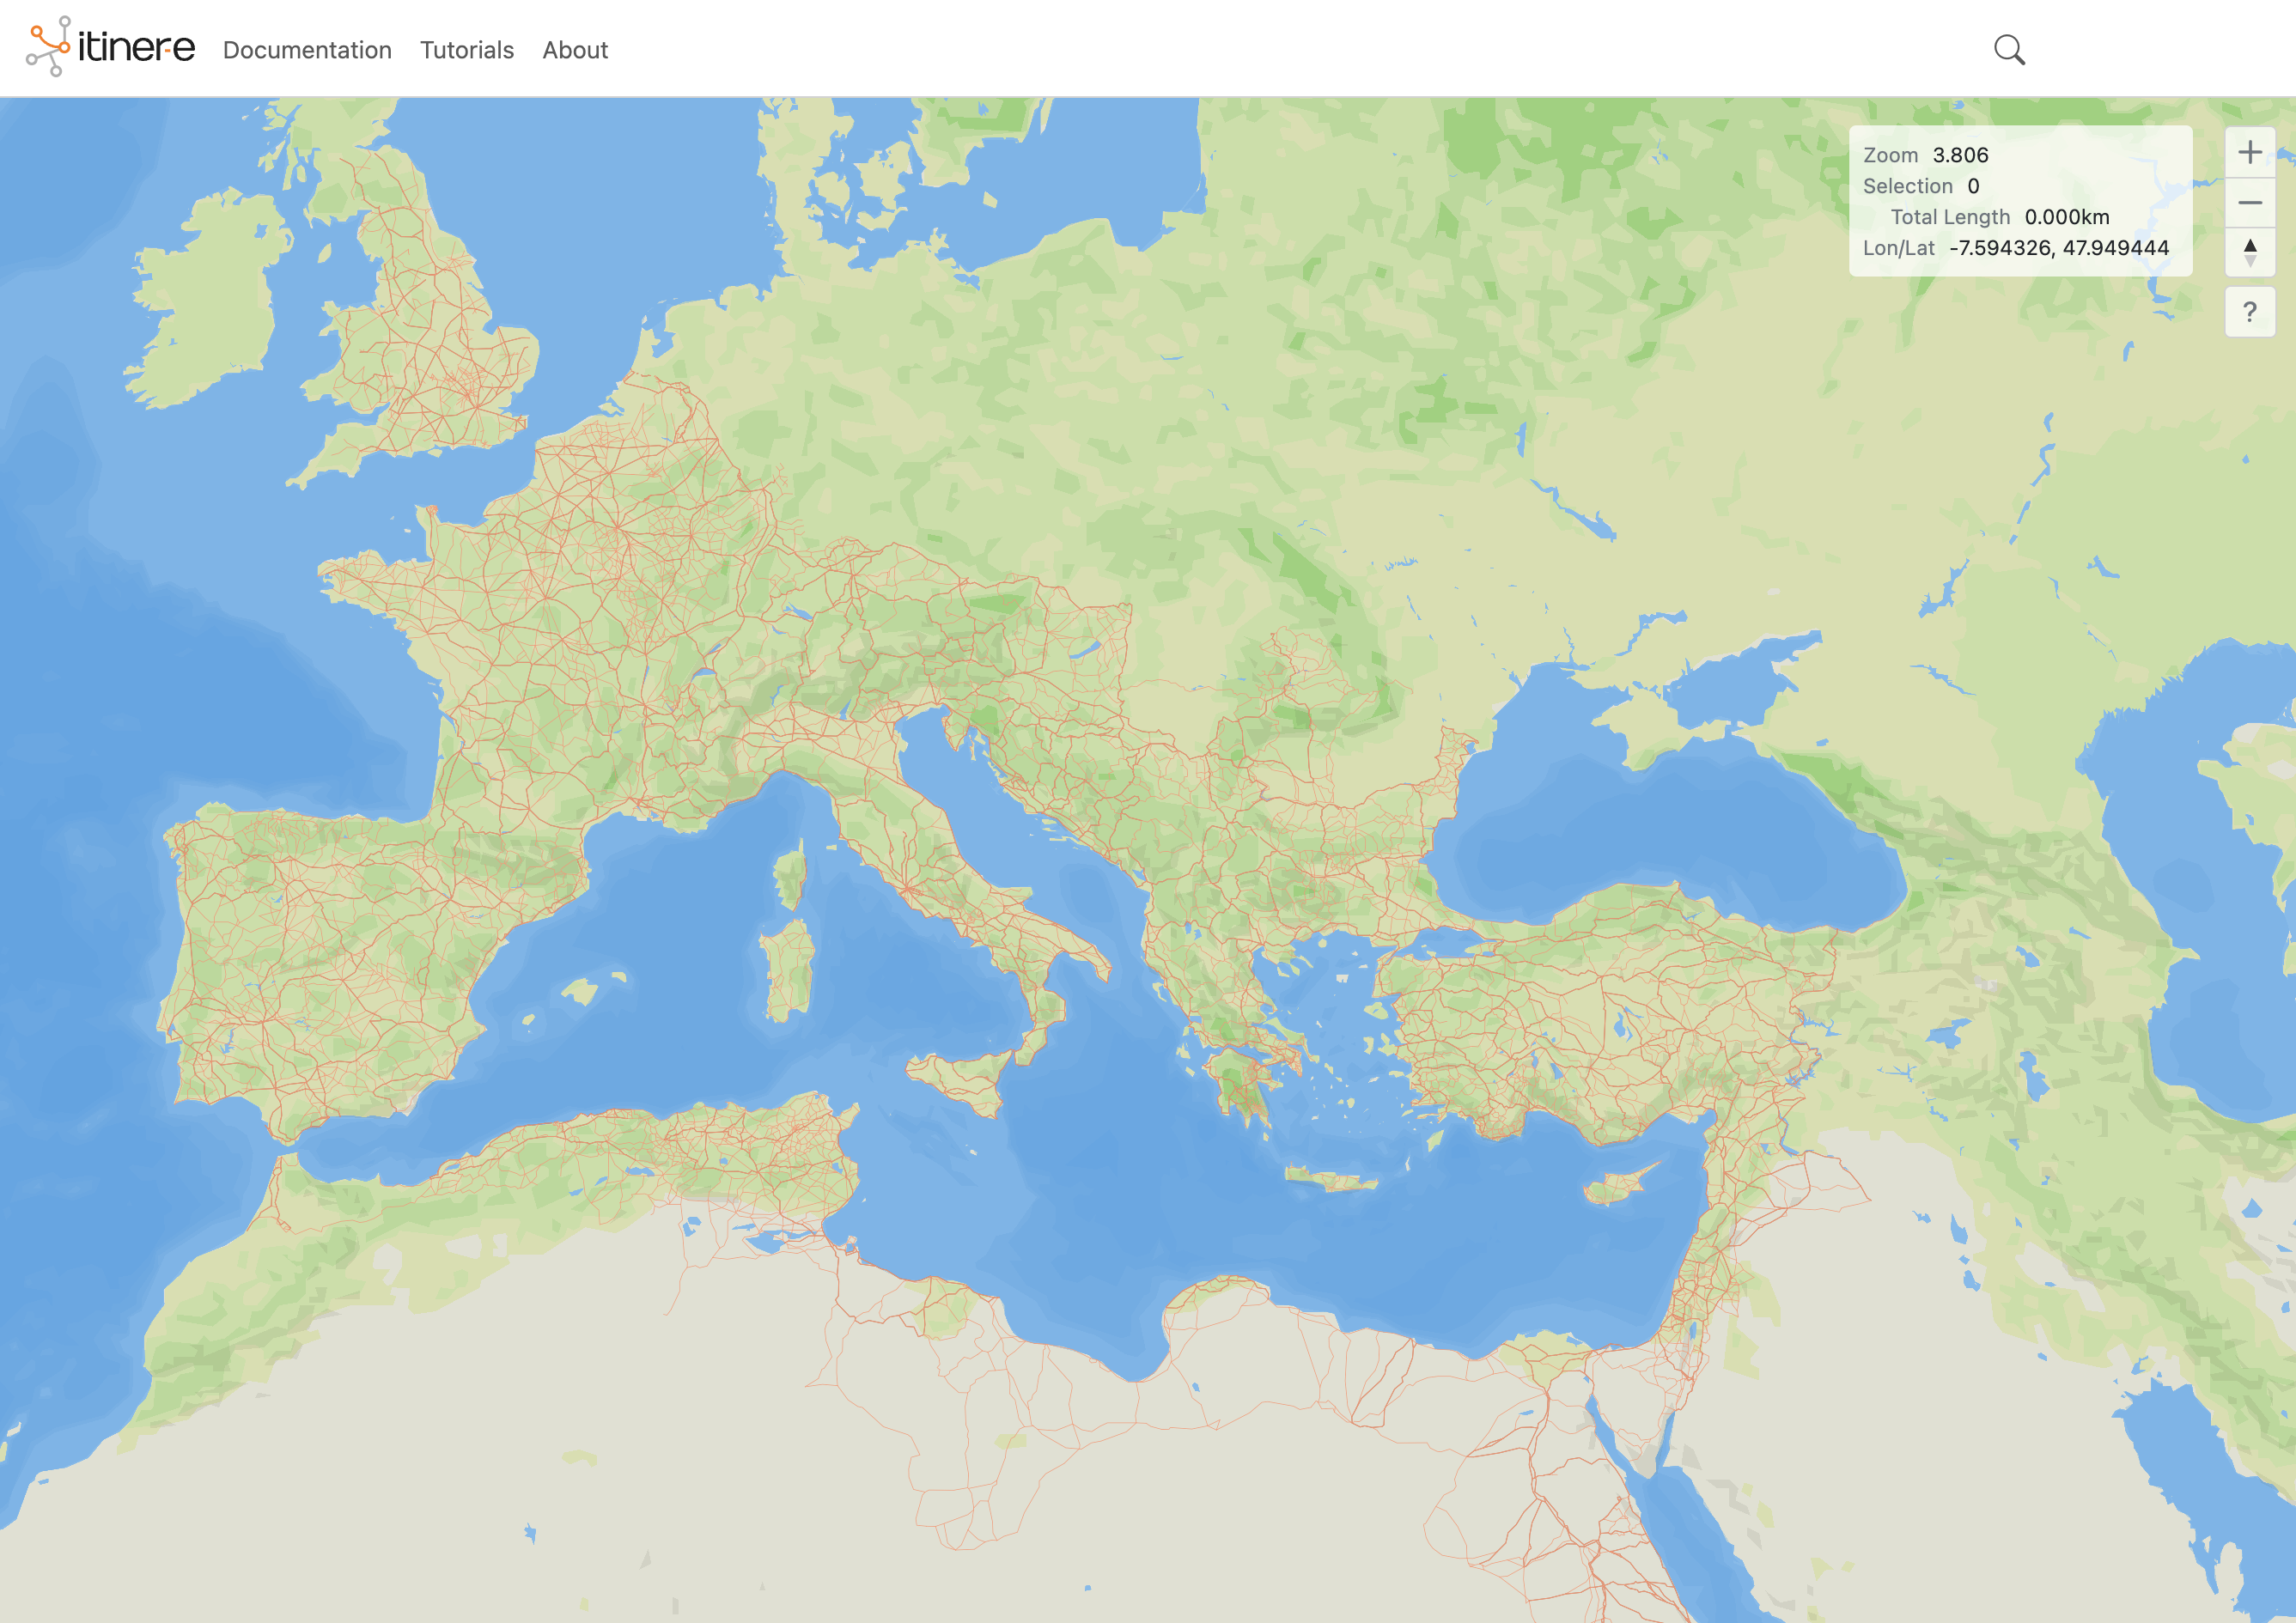
Open Infrastructure Map is an open-source map of the world's infrastructure using data from OpenStreetMap.
The Impact Map
United States of America 🇺🇸The Impact Map provides timely data—as it becomes available—on policy, funding, and workforce changes and their localized effect. This tool is currently in beta and will continue evolving, so you may find areas that need updating.
FCC National Broadband Map
Washington, DCThis map displays where Internet services are available across the United States, as reported by Internet Service Providers (ISPs) to the FCC. The map will be updated continuously to improve its accuracy through a combination of FCC verification efforts, new data from Internet providers, updates to the location data, and—importantly—information from the public.

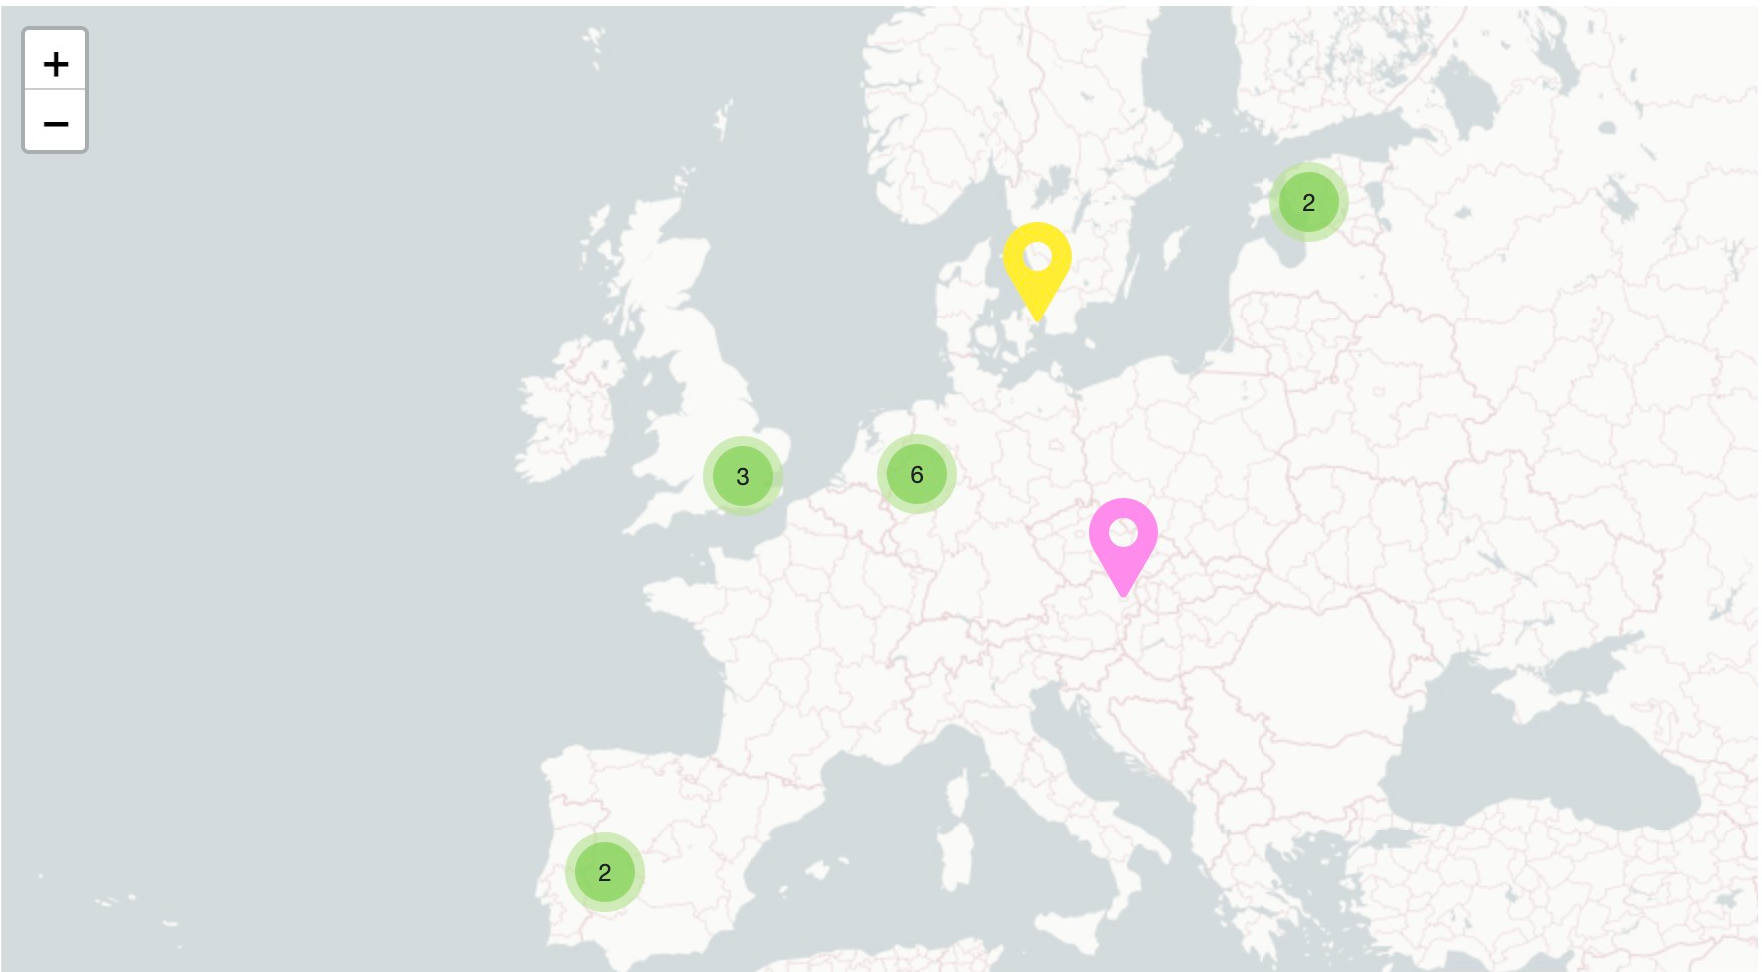
Our Mapping Civic Education in Europe programme is a dynamic initiative continuously evolving by adding new countries to the first-ever pan-European virtual map of civic educators.
Congestion Pricing Tracker
Brown UniversityCurious whether Congestion Pricing is having an impact on commutes in NYC? Take a look to compare traffic data before and after Congestion Pricing
Civic Information Index
Internews Network, 15th Street Northwest, Washington, DCThe Civic Information Index uses data to map drivers of engaged, informed, equitable, and healthy communities nationwide.

The Upward Mobility Dashboard helps people understand key conditions affecting upward mobility from poverty and racial equity in communities.

Community Network Map
United States of America 🇺🇸This map shows municipal networks across the United States.

Healthsites.io establishes this data and the tools necessary to upload, manage and make the data easily accessible.
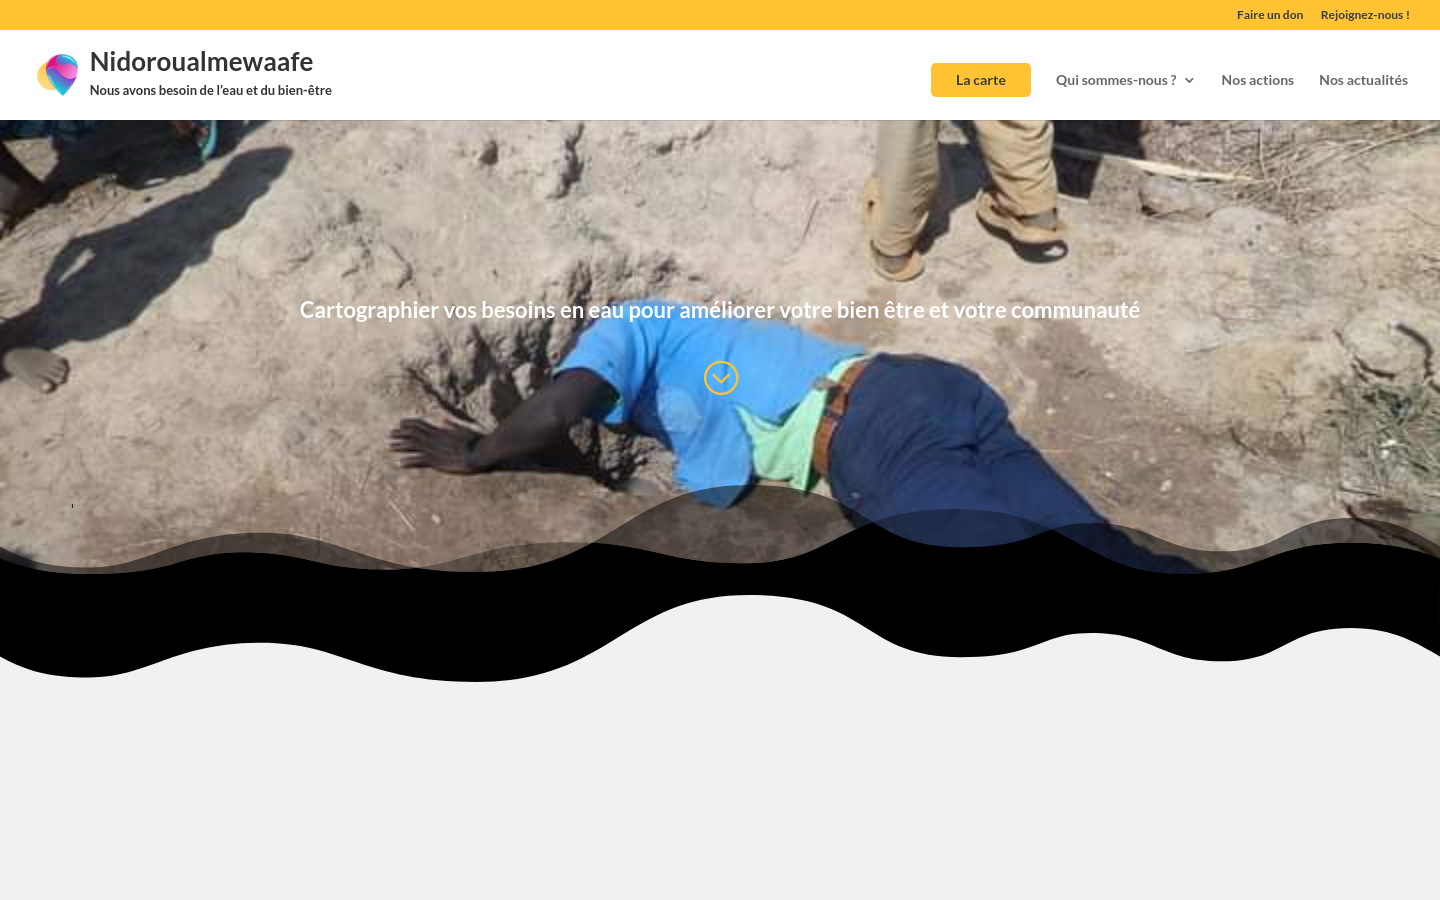
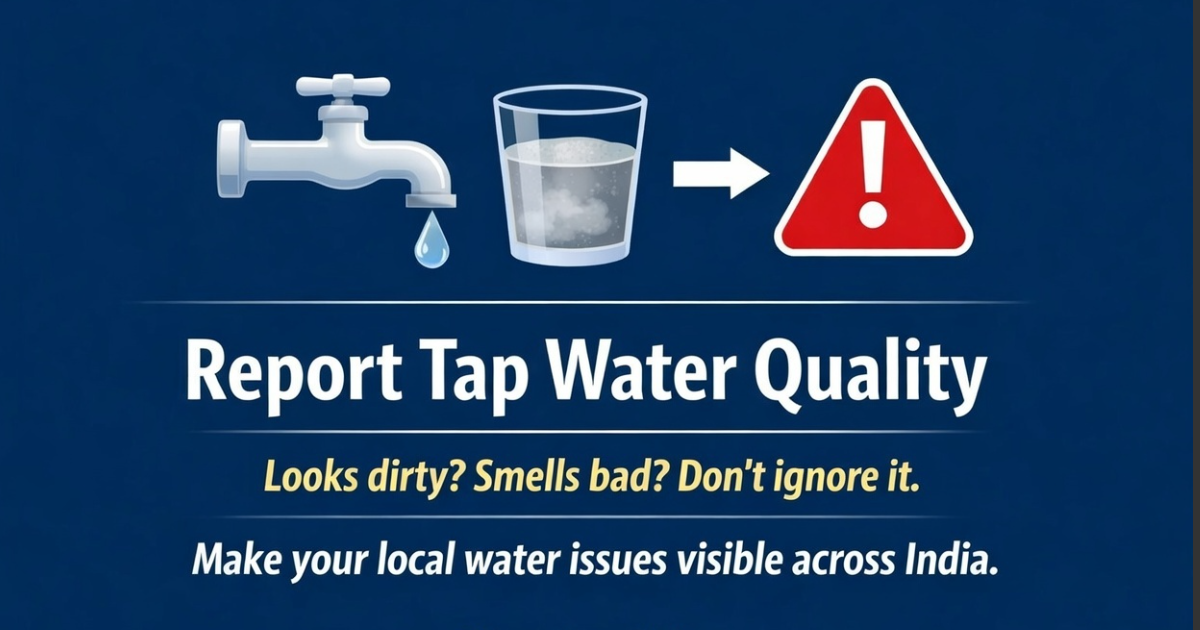
NIDOROUALMEwaAFE
Chad (Tchad) 🇹🇩Using GPS mapping technology, Nidoroualmewaafe identifies areas that do not have access to safe drinking water and shares this information with local authorities and communities to inform decision-making.

This map...illustrates a [Congress] in a state of dysfunction, with growing dissatisfaction on the part of the public, waning trust in its ability perform, and -- most significantly -- large-scale disengagement from the system by the public.

Give Food
United Kingdom of Great Britain and Northern Ireland 🇬🇧We're a UK charity that uses data to highlight local and structural food insecurity then provides tools to help alleviate it.

UK Constituency Data Hex Maps
United Kingdom of Great Britain and Northern Ireland 🇬🇧This site maps data about UK constituencies on hex maps (cartograms). We have created several themes (economy, energy, environment, health, society, and transport) and have filled those with separate pages for each data aspect.
Get email updates
Helpful Links
Reach Out
A project of

With support from
National Endowment for Democracy
Founding Organization
Civic Hall
Technology partner