Civic Tech Field Guide
Sharing knowledge and productively growing the fieldThe Tech > Civic data > Data visualization > Dashboards - (70)
Dashboards present and visualize key data, including trends and hotspots, in a single glance. The most common example in this subgenre are municipal dashboards, which display data indicators across a city for operators or citizens to monitor.
Suggested reading:
Heather Froehlich and Michael Correll question if dashboards are "acting not as aids to decision-making but as devices to be passively consumed or observed: spectacles to “take in” rather than tools to guide action".
Katya Abazajian asks, "When so many data dashboards offer few satisfying answers, we might wonder why local leaders default to building them again, and again, and again. Is it too late to give dashboards a new purpose?"
Govtech: Chief data officers gathering at the Bloomberg CityLab conference in Amsterdam recently looked back on all those data dashboards so quickly built during the height of the COVID-19 pandemic in 2020.
Showing 70 Results
HalexDream!
Saitama, JapanProviding weather, earthquake, disaster prevention and lifestyle-related information as well as consultation on its usage.

Agri Note (Farming Records & Open Data Platform)
Saitama, JapanAn agricultural support app promoting the shift 'From memory to records' in farming.
Beacon
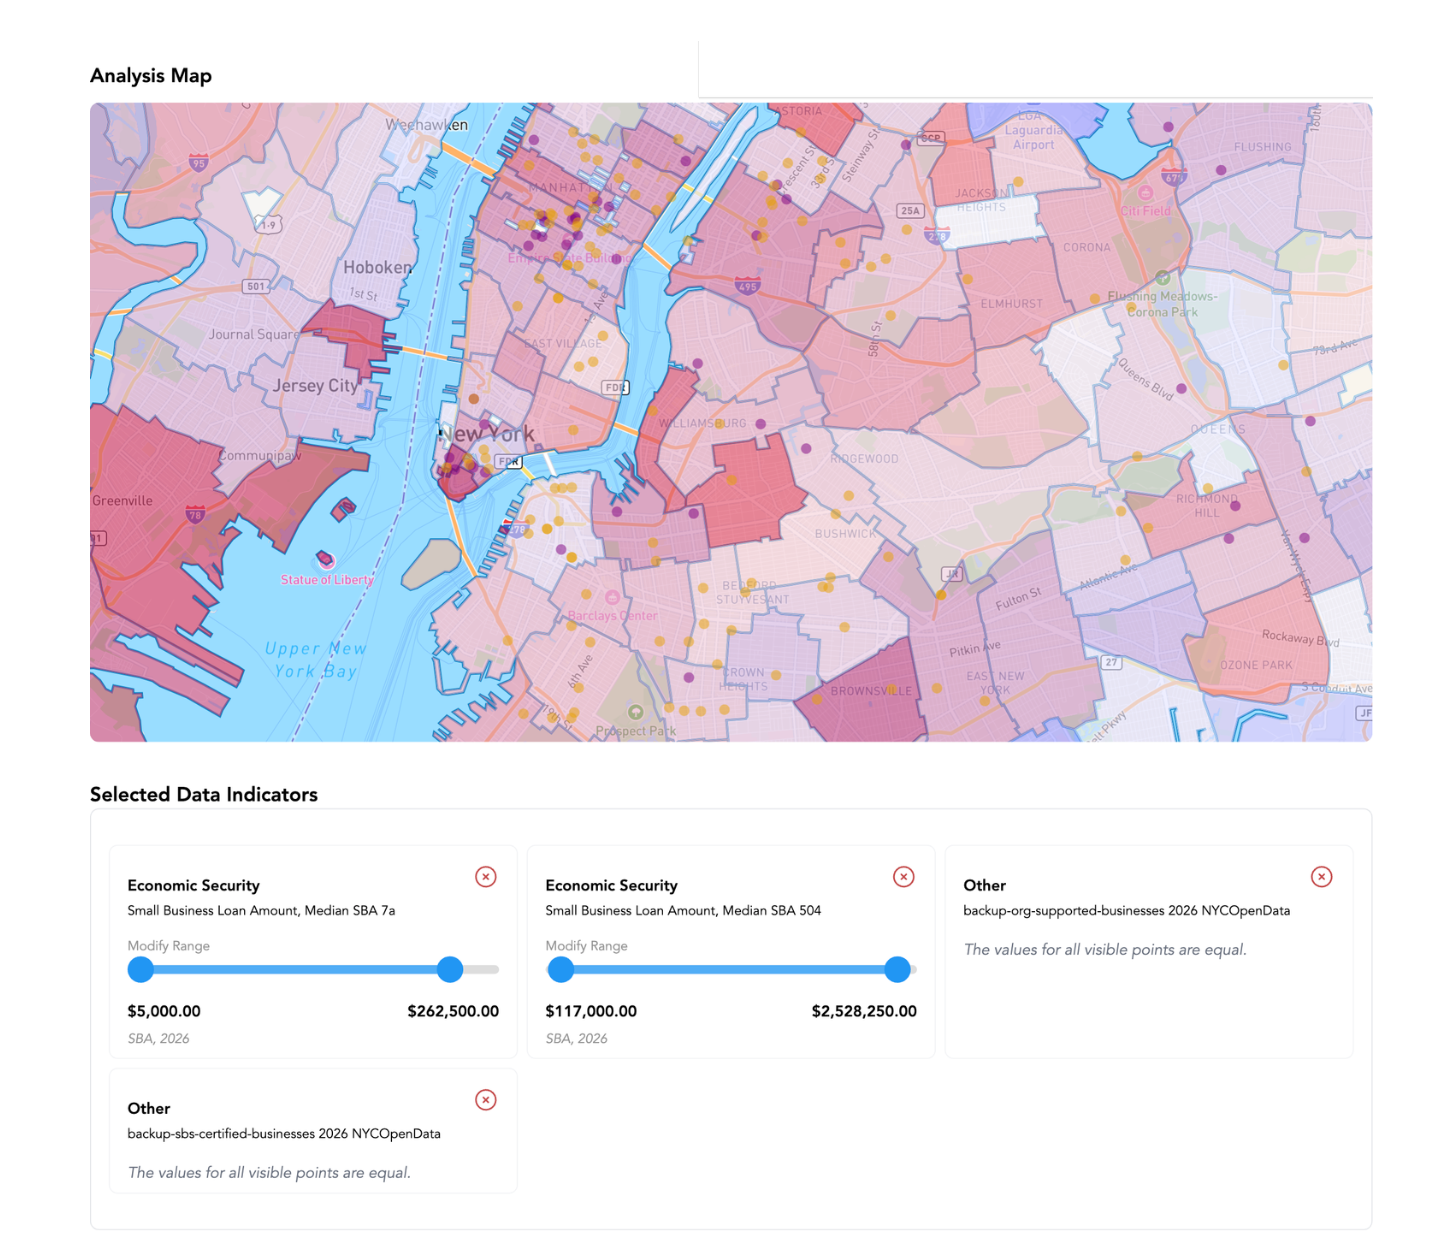
New York City (NYC / New York, NY)Beacon brings together public data on economic security, health, housing, and more into clear, place-based maps your whole team can use.

Kyoto City's open data initiative has reduced information disclosure requests and promotes regional revitalization through citizen collaboration
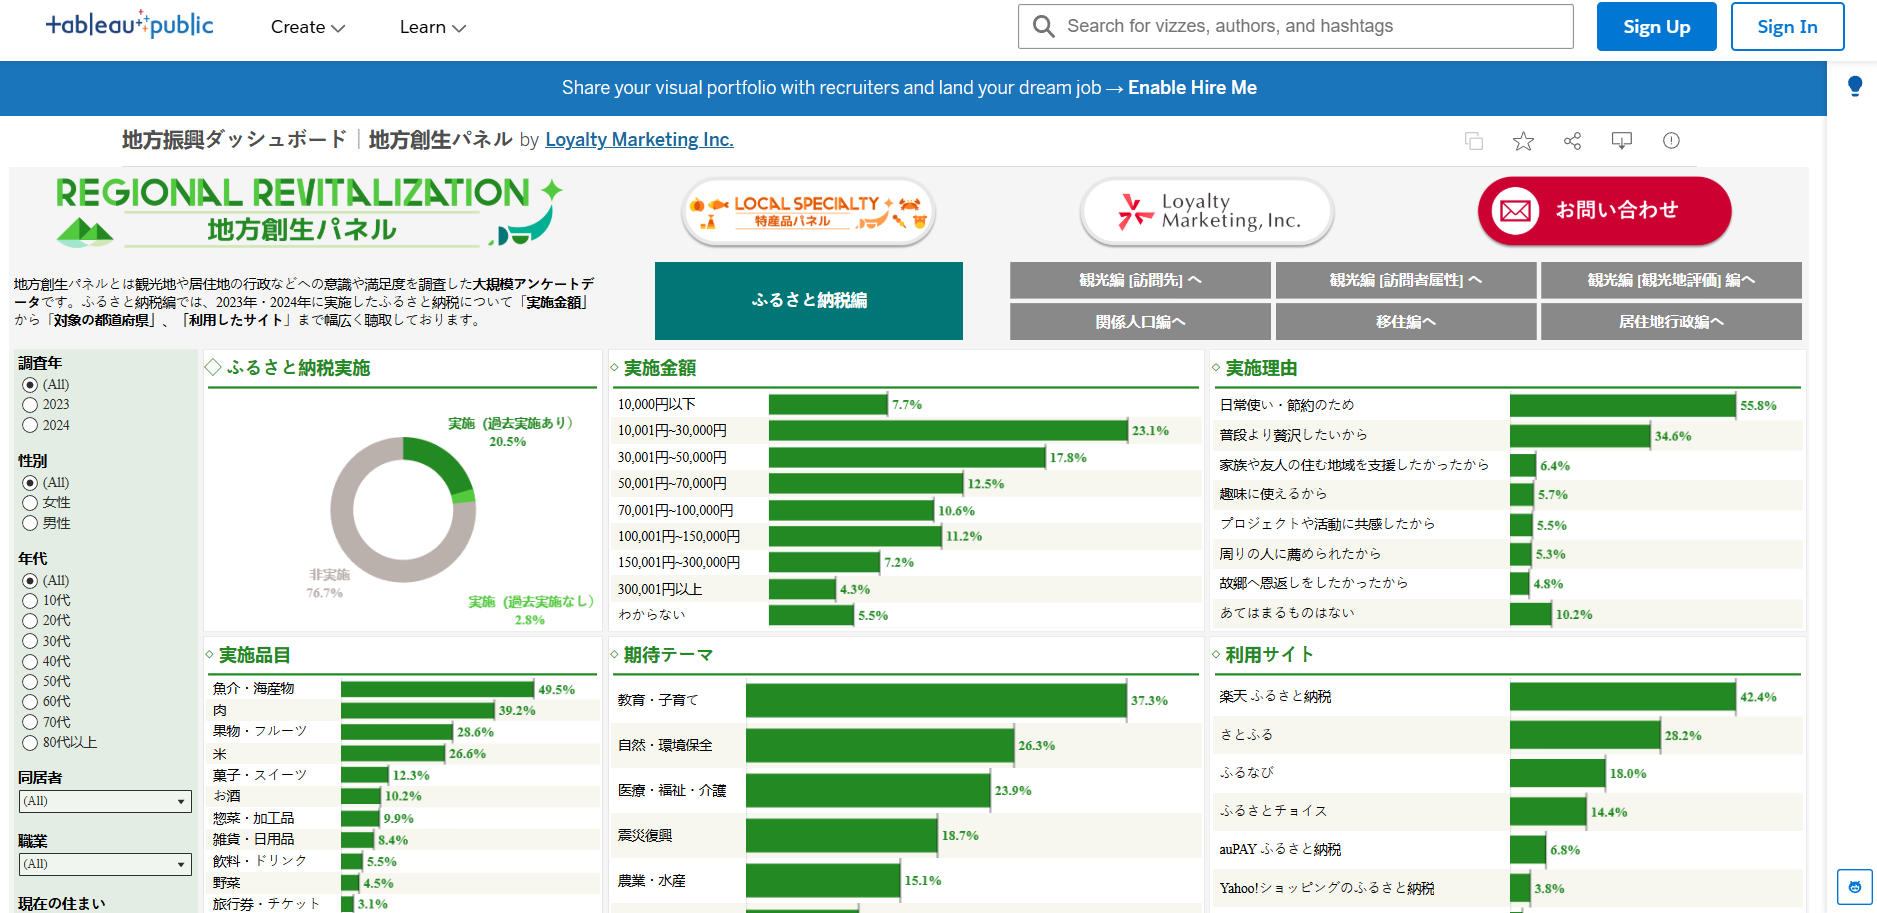
Regional revitalization dashboard by LM on Tableau Public covering local products, hometown tax, and tourism satisfaction

Hyogo Prefecture's open data dashboard published on Tableau Public

SomosTorre
TorrelavegaPlataforma cívica gratuita para Torrelavega. Transporte en tiempo real, eventos, comercio local y servicios municipales.
Every City In The USA is a city data explorer that lets people filter, compare, source, and export complete city population lists alongside sourced cost-of-living, climate, housing, tax, wage, and other official-data layers
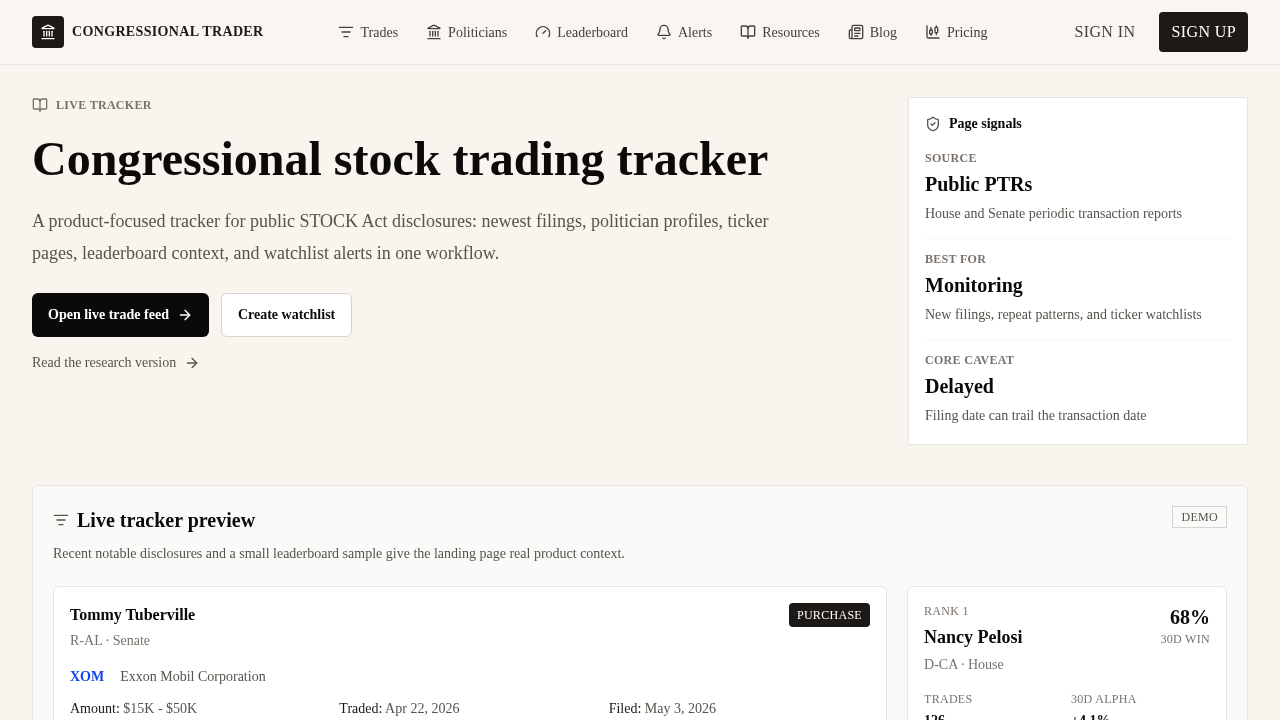
Congressional Trader
Menlo Park, CAA free civic-data tracker for U.S. Congress stock trades disclosed through public STOCK Act filings.
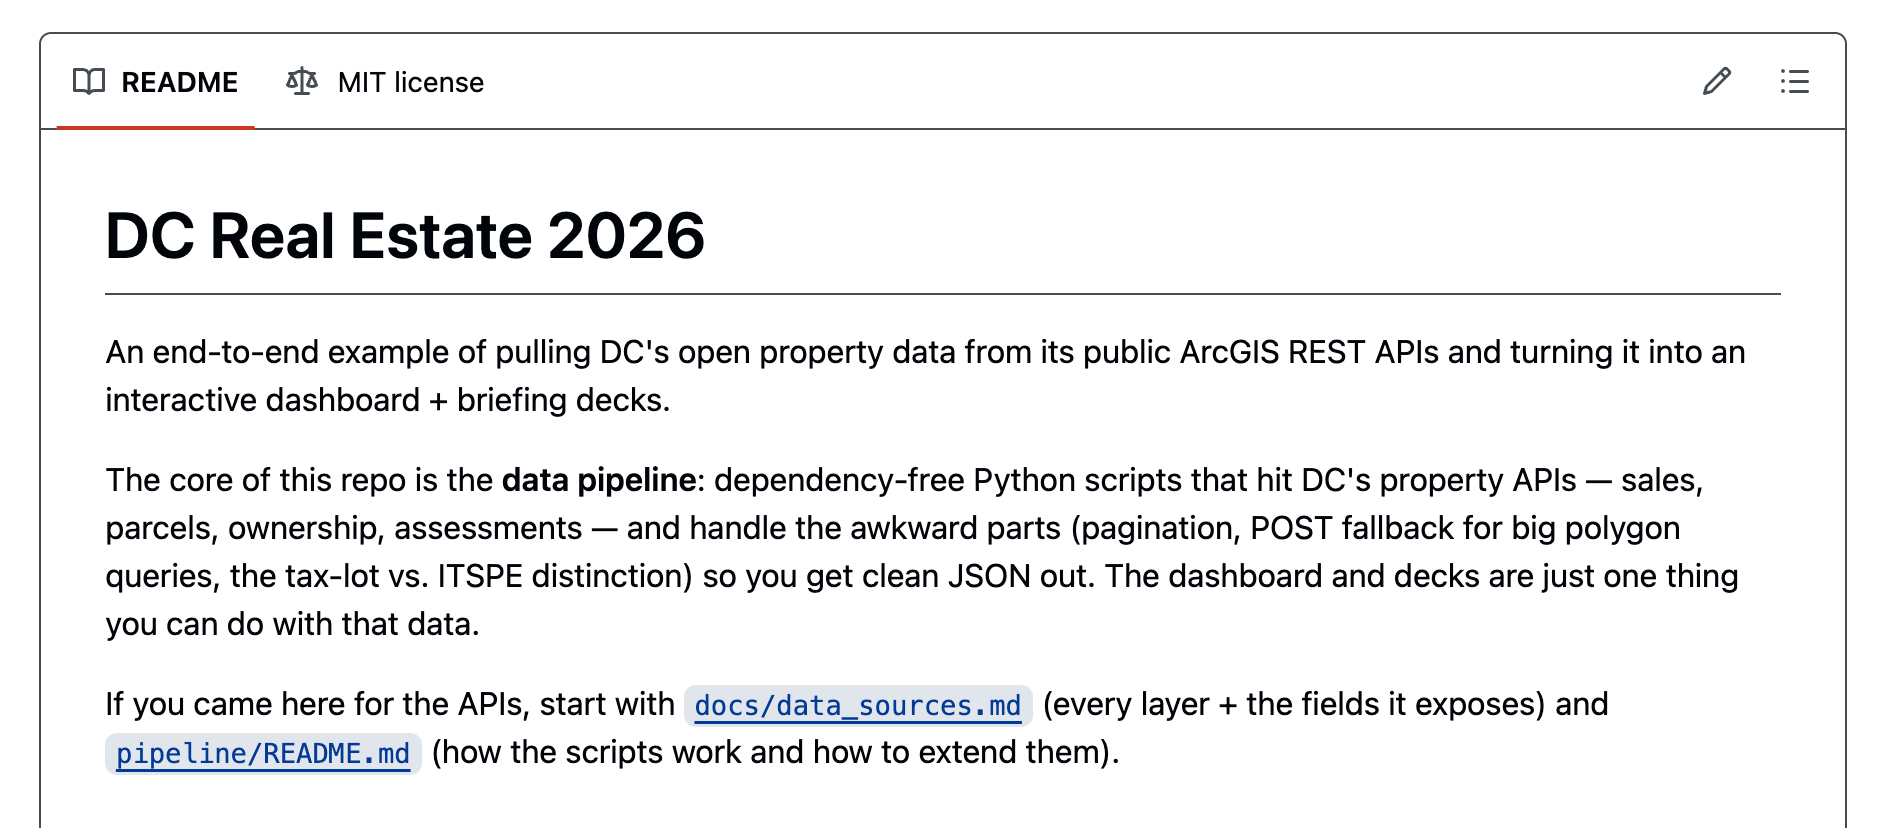
DC Real Estate 2026
Washington, DCAn end-to-end example of pulling DC's open property data from its public ArcGIS REST APIs and turning it into an interactive dashboard + briefing decks.
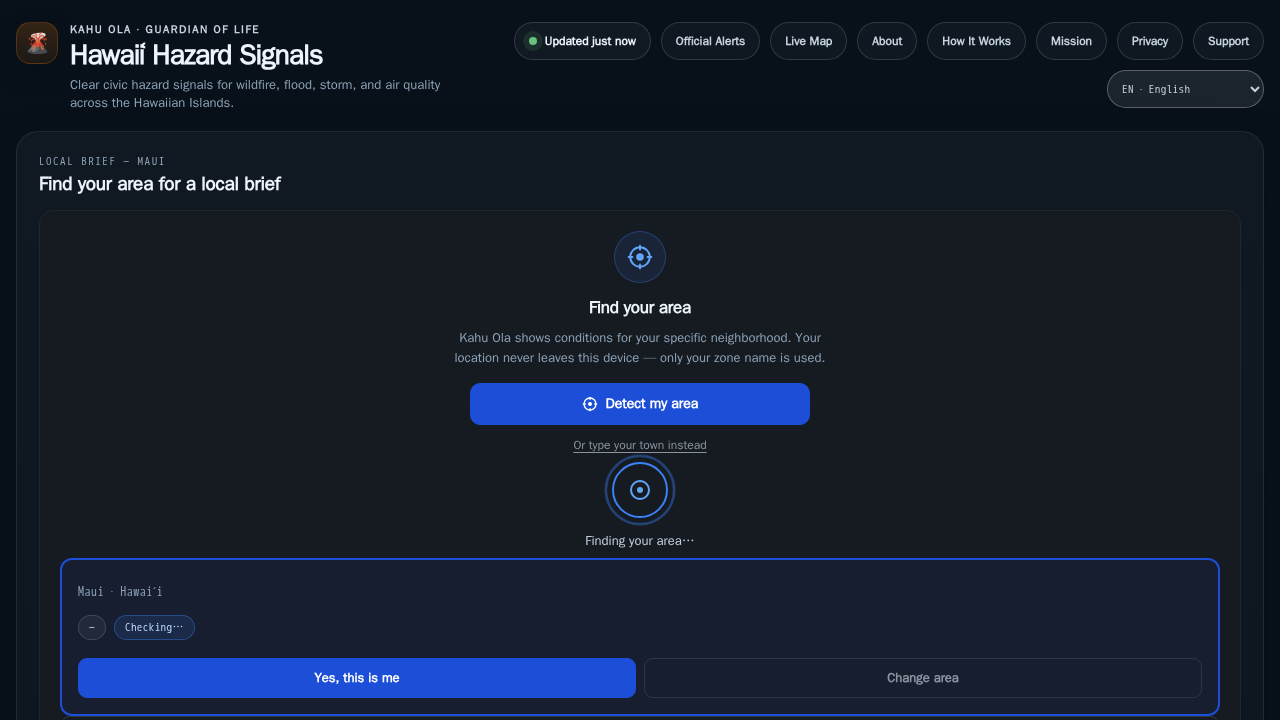
Kahu Ola
HawaiiHawaiʻi civic hazard intelligence platform aggregating real-time wildfire, air quality, weather, and volcanic data from NASA, NOAA, NWS, EPA, and PacIOOS.
Civic Data Atlas
ChicagoBringing comprehensive Census demographic profiles to city council districts for the first time.
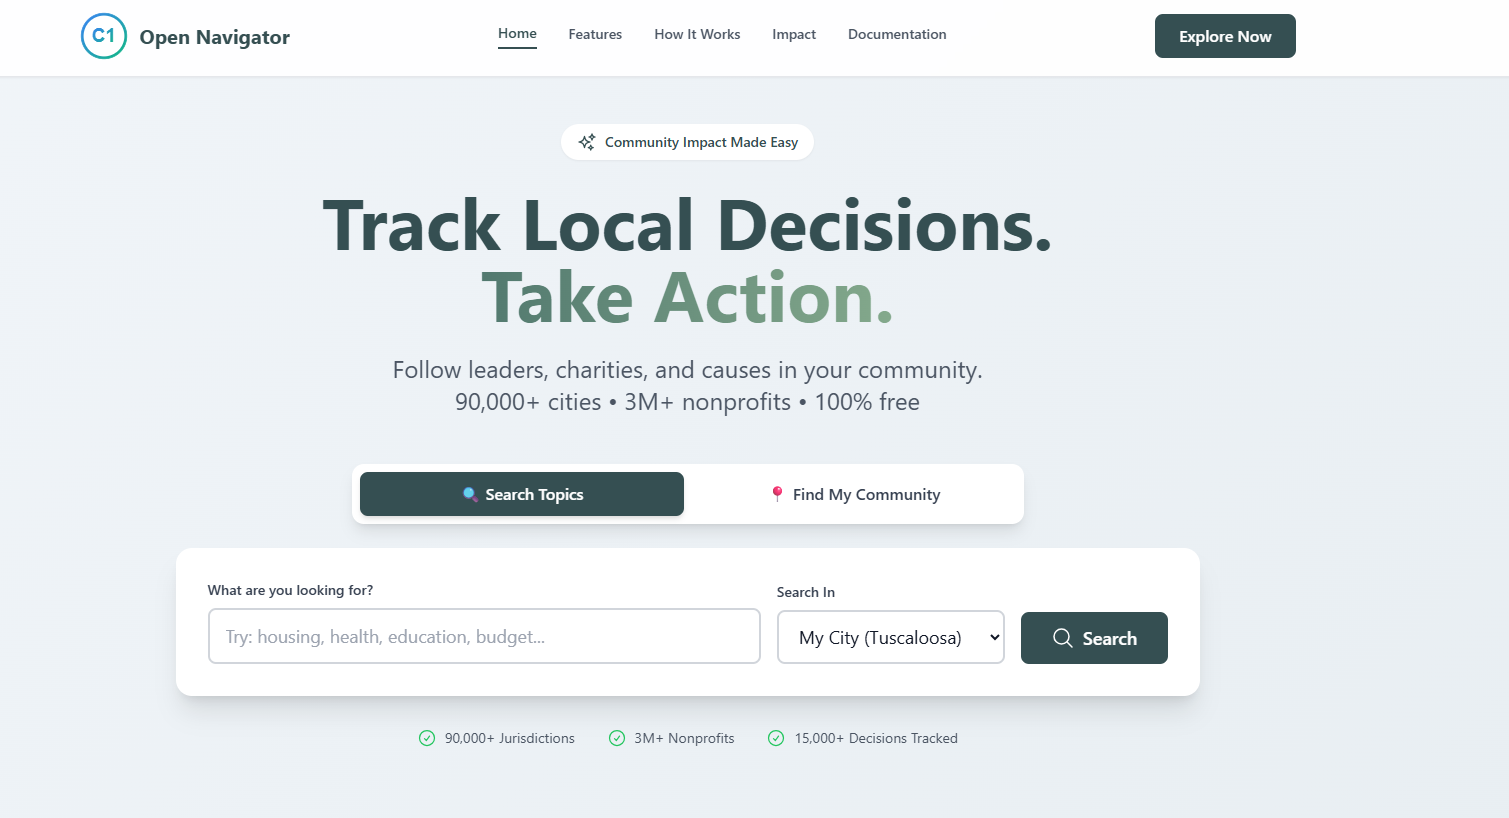
CommunityOne
5617 Lakeridge Court TuscaloosaCommunityOne is a cloud-native local community data exchange platform designed to streamline secure data sharing and interoperability through an open system designed to promote engagement.
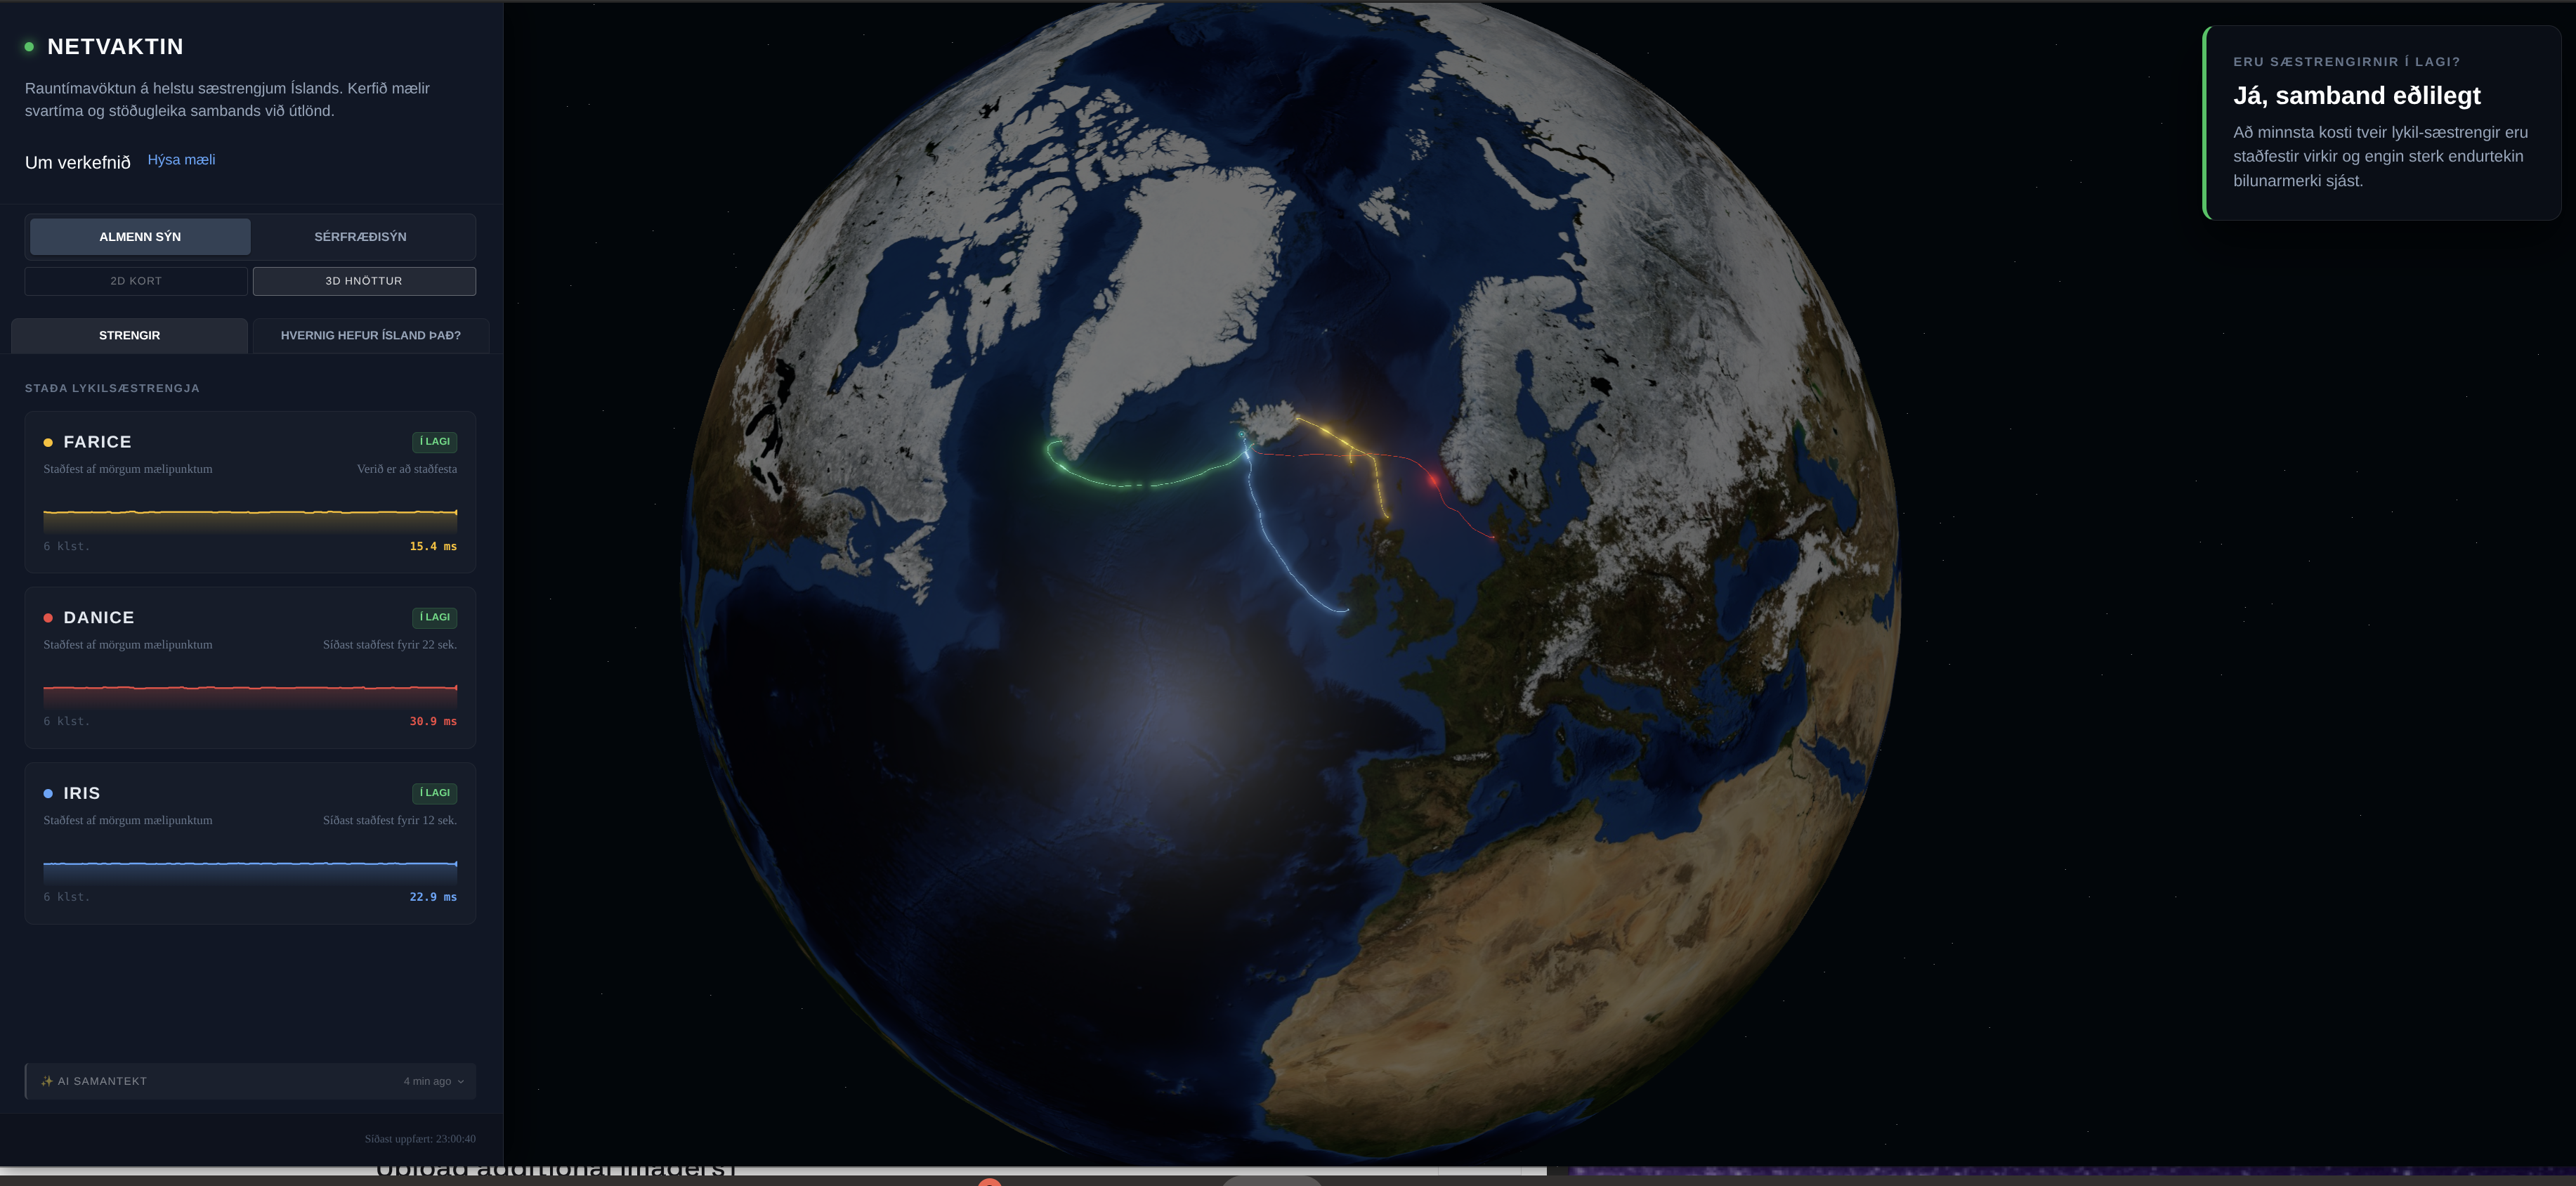
Netvaktin
Iceland (Ísland) 🇮🇸An open-source, real-time network observatory that monitors the resilience, latency, and routing health of Iceland's critical submarine internet cables.
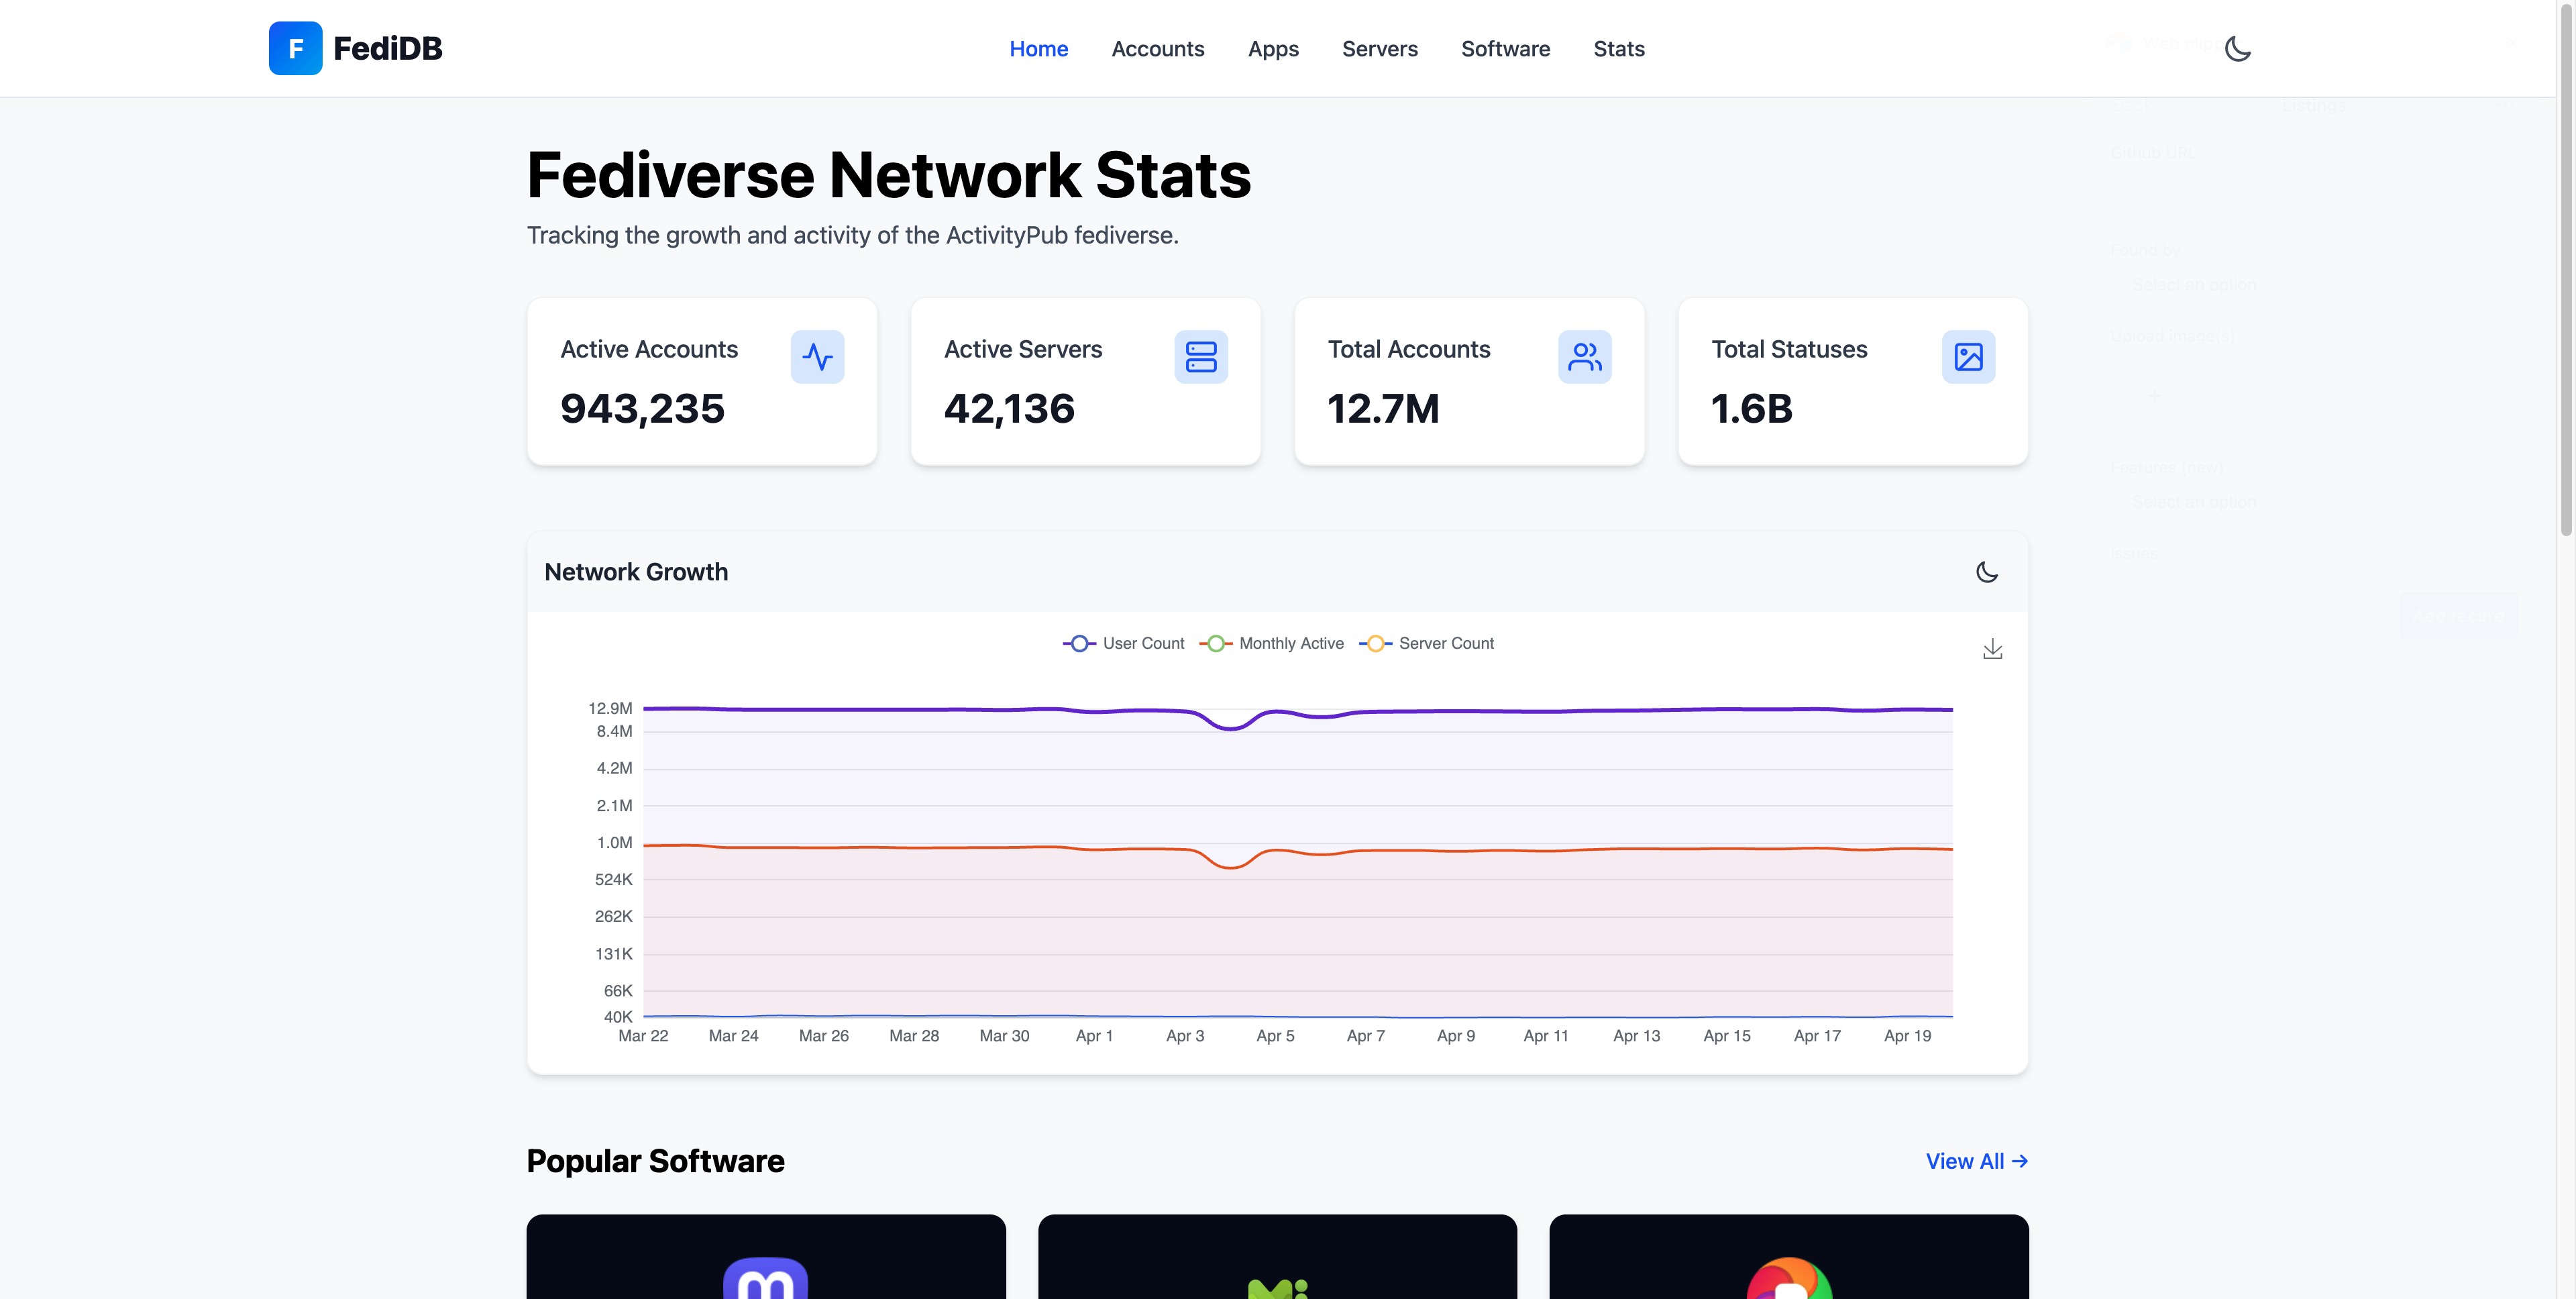
The Complete Fediverse Directory & Analytics Platform
Deep Dive Data
Zimbabwe 🇿🇼Our comprehensive database analyzes banking and financial apps to reveal what data they collect and how they use it.
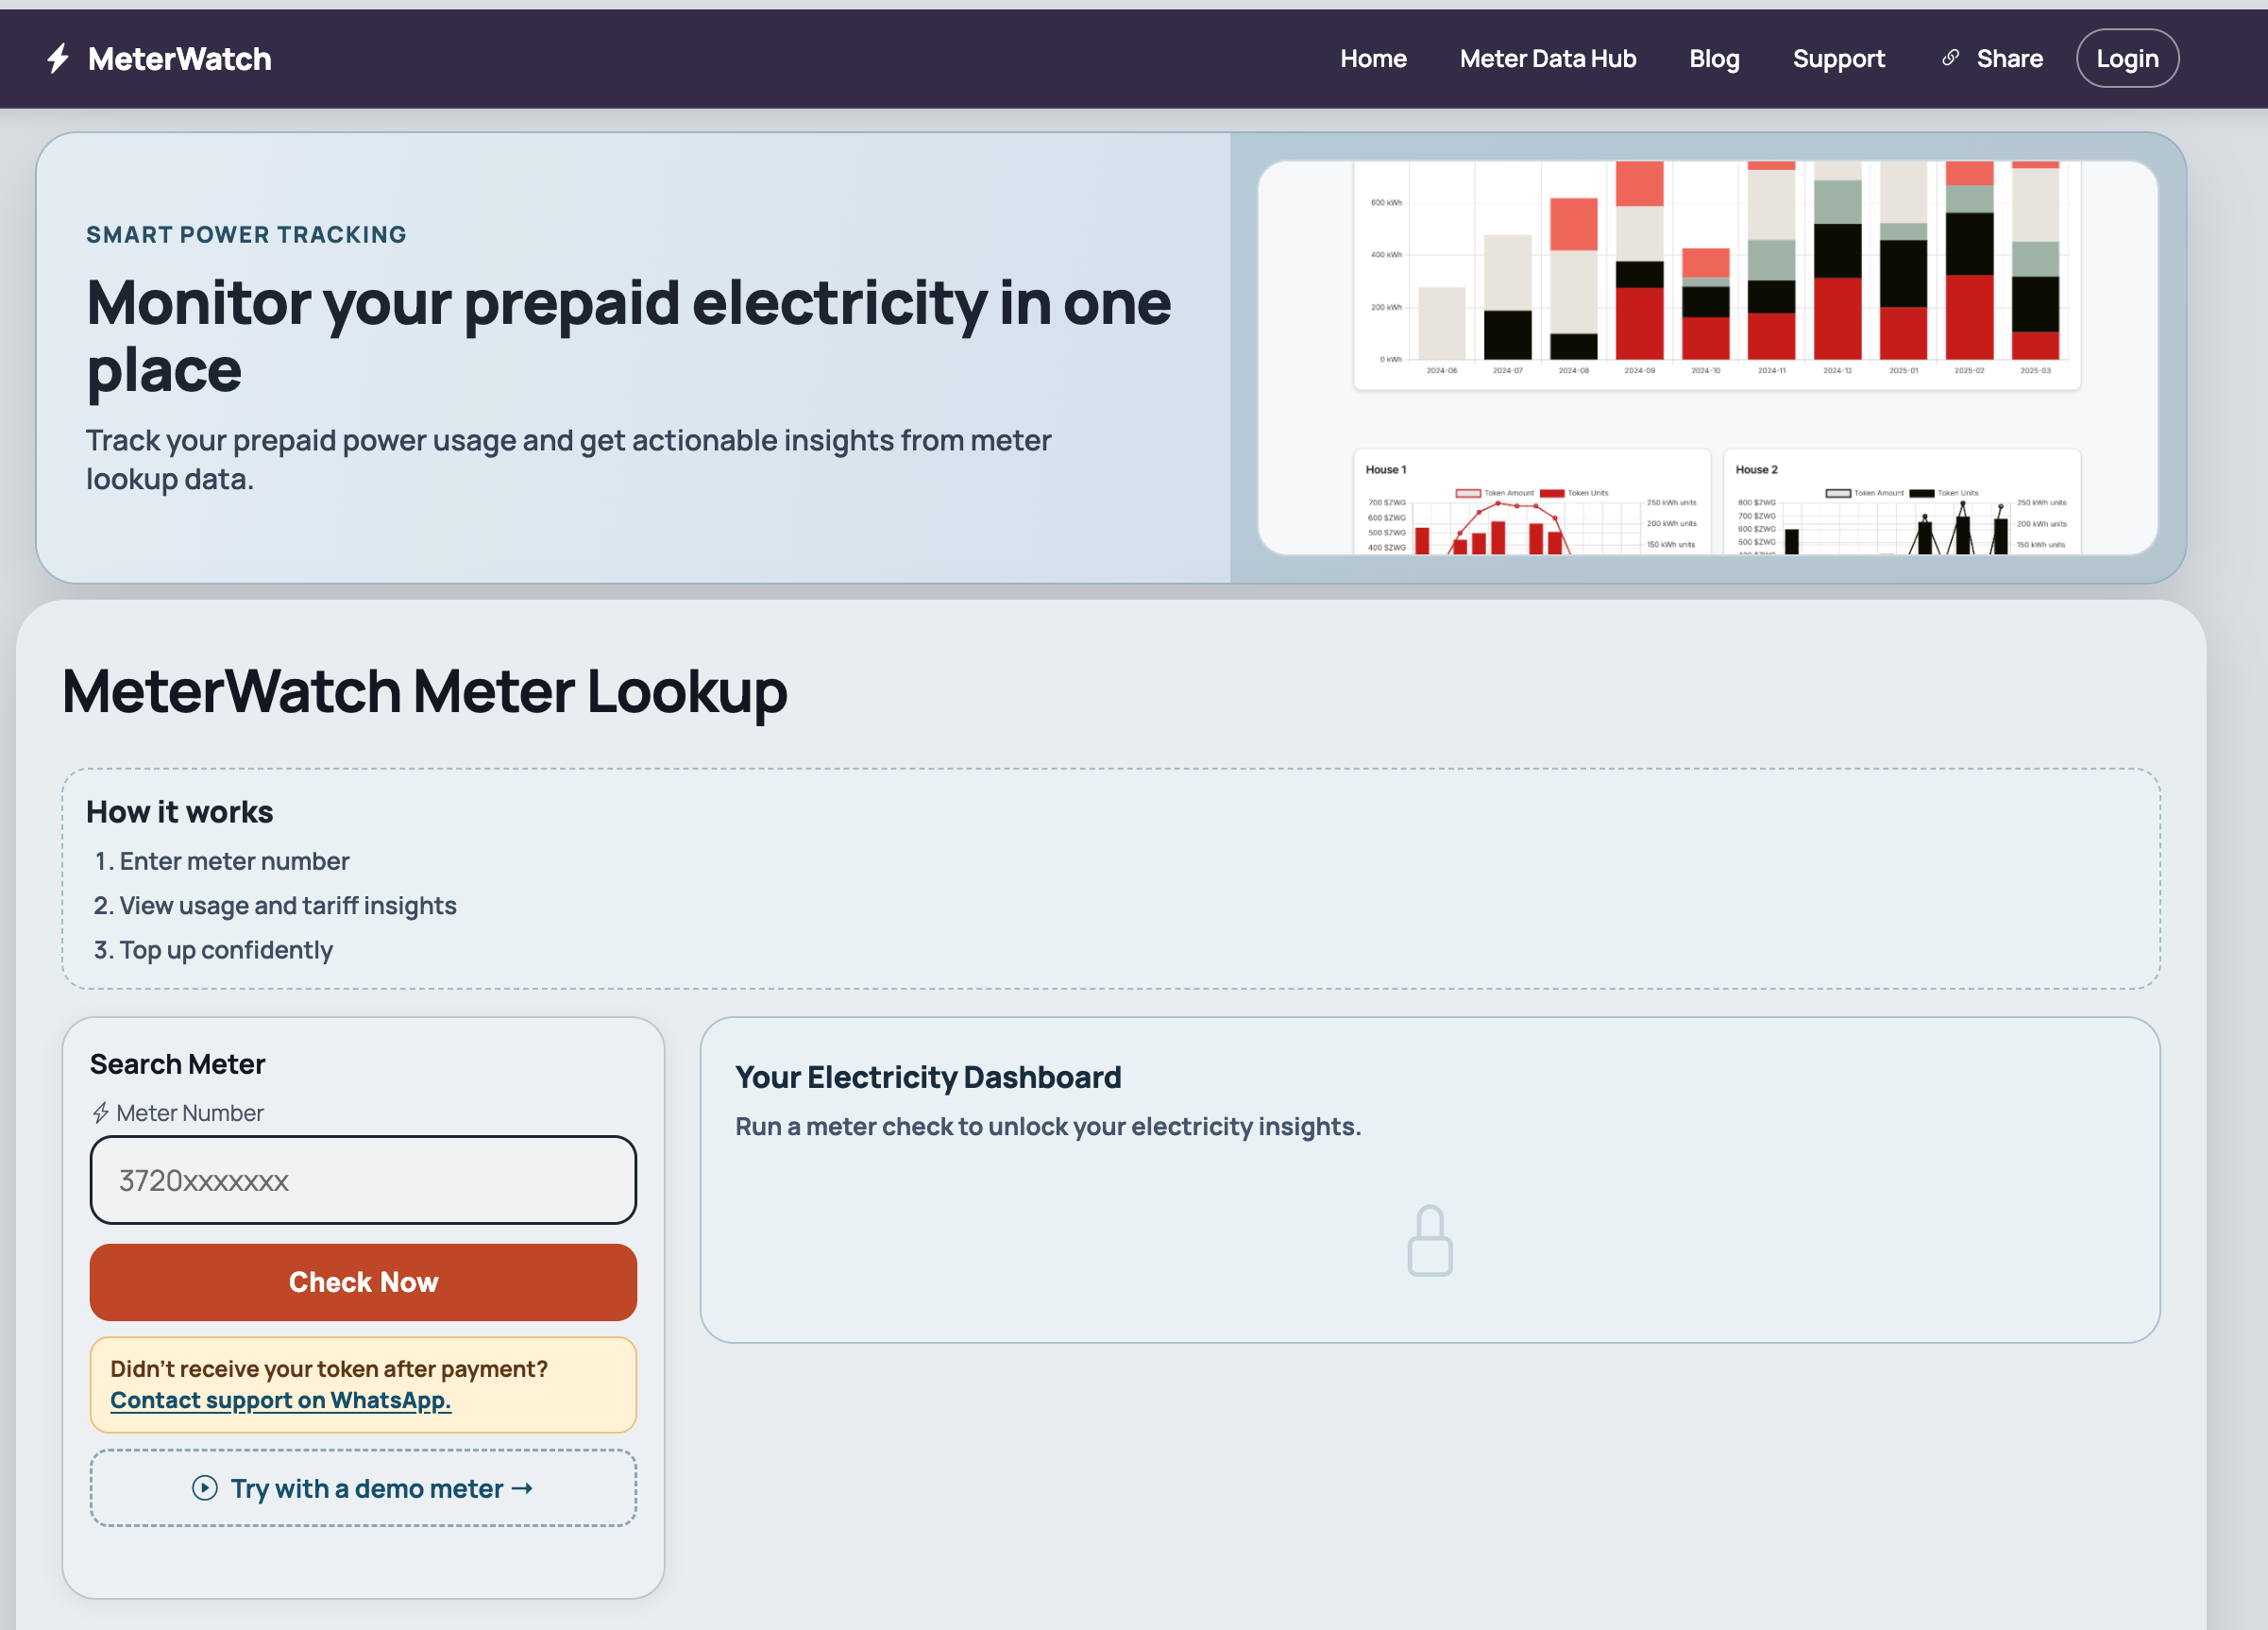
MeterWatch
Zimbabwe 🇿🇼Track your prepaid power usage and get actionable insights from meter lookup data.
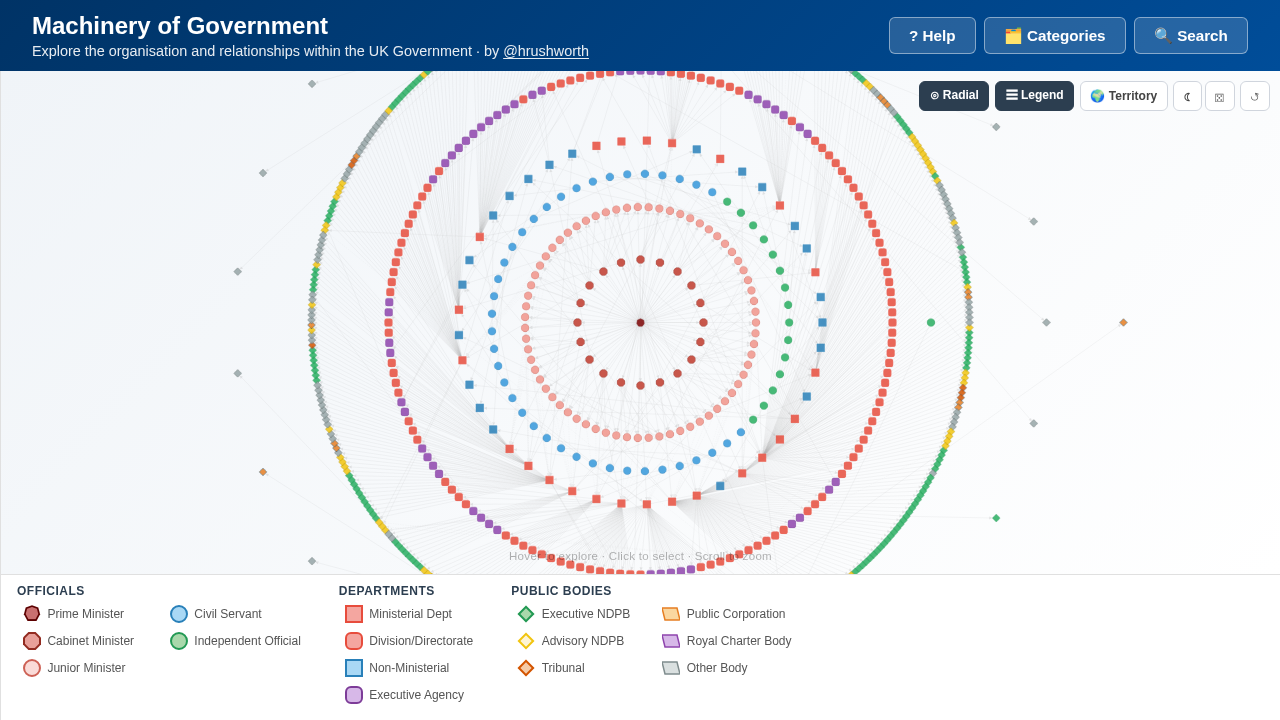
Machinery of Government
United Kingdom of Great Britain and Northern Ireland 🇬🇧An interactive map of UK Government structure — departments, ministers, agencies, and public bodies, with budget and staffing data.
Interactive dashboards and public information from the Ohio Secretary of State.

Russia-Ukraine ConflictMisinfo
TorontoThe portal is a resource for analysts, researchers, and members of the public who are interested in understanding the nature and scale of online misinformation and disinformation about the Russia-Ukraine war.

Deepfakes Tracker
TorontoThe portal is designed to serve as a comprehensive resource for policymakers, researchers, journalists, the public, and other stakeholders to monitor the prevalence of deepfakes and understand their potential threats to society.
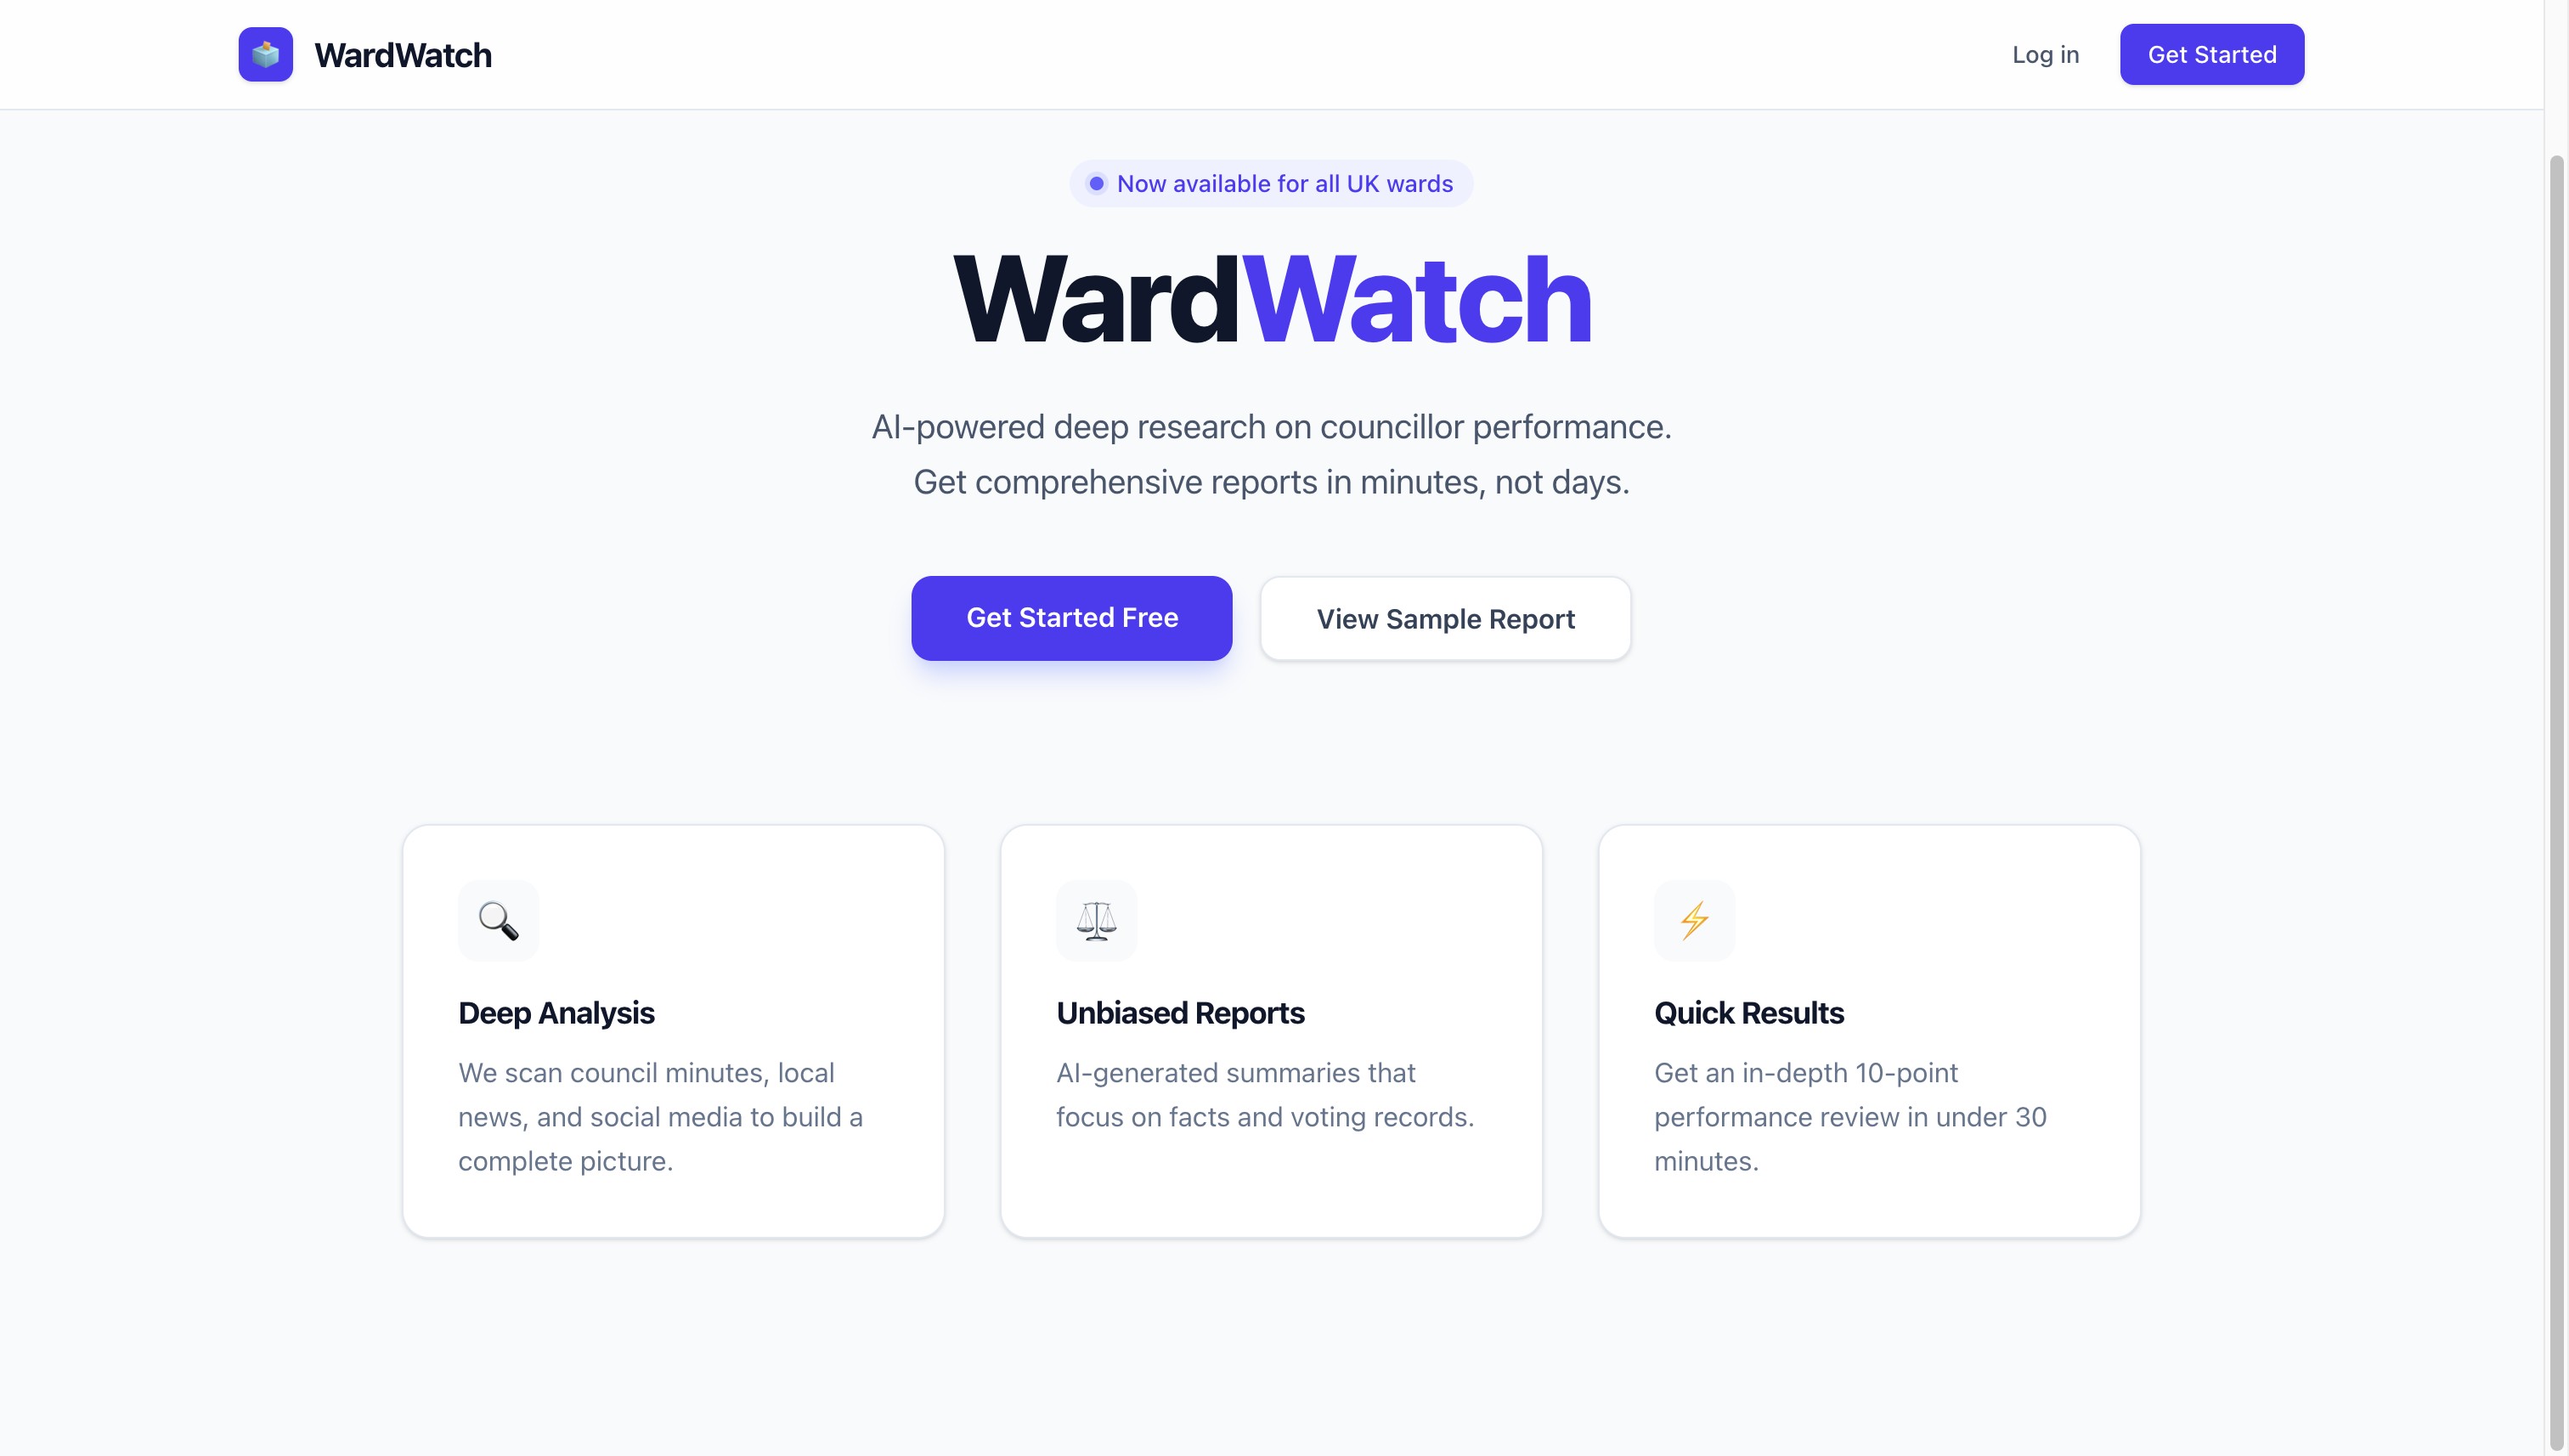
WardWatch
LondonAI-powered deep research on councillor performance. Get comprehensive reports in minutes, not days.
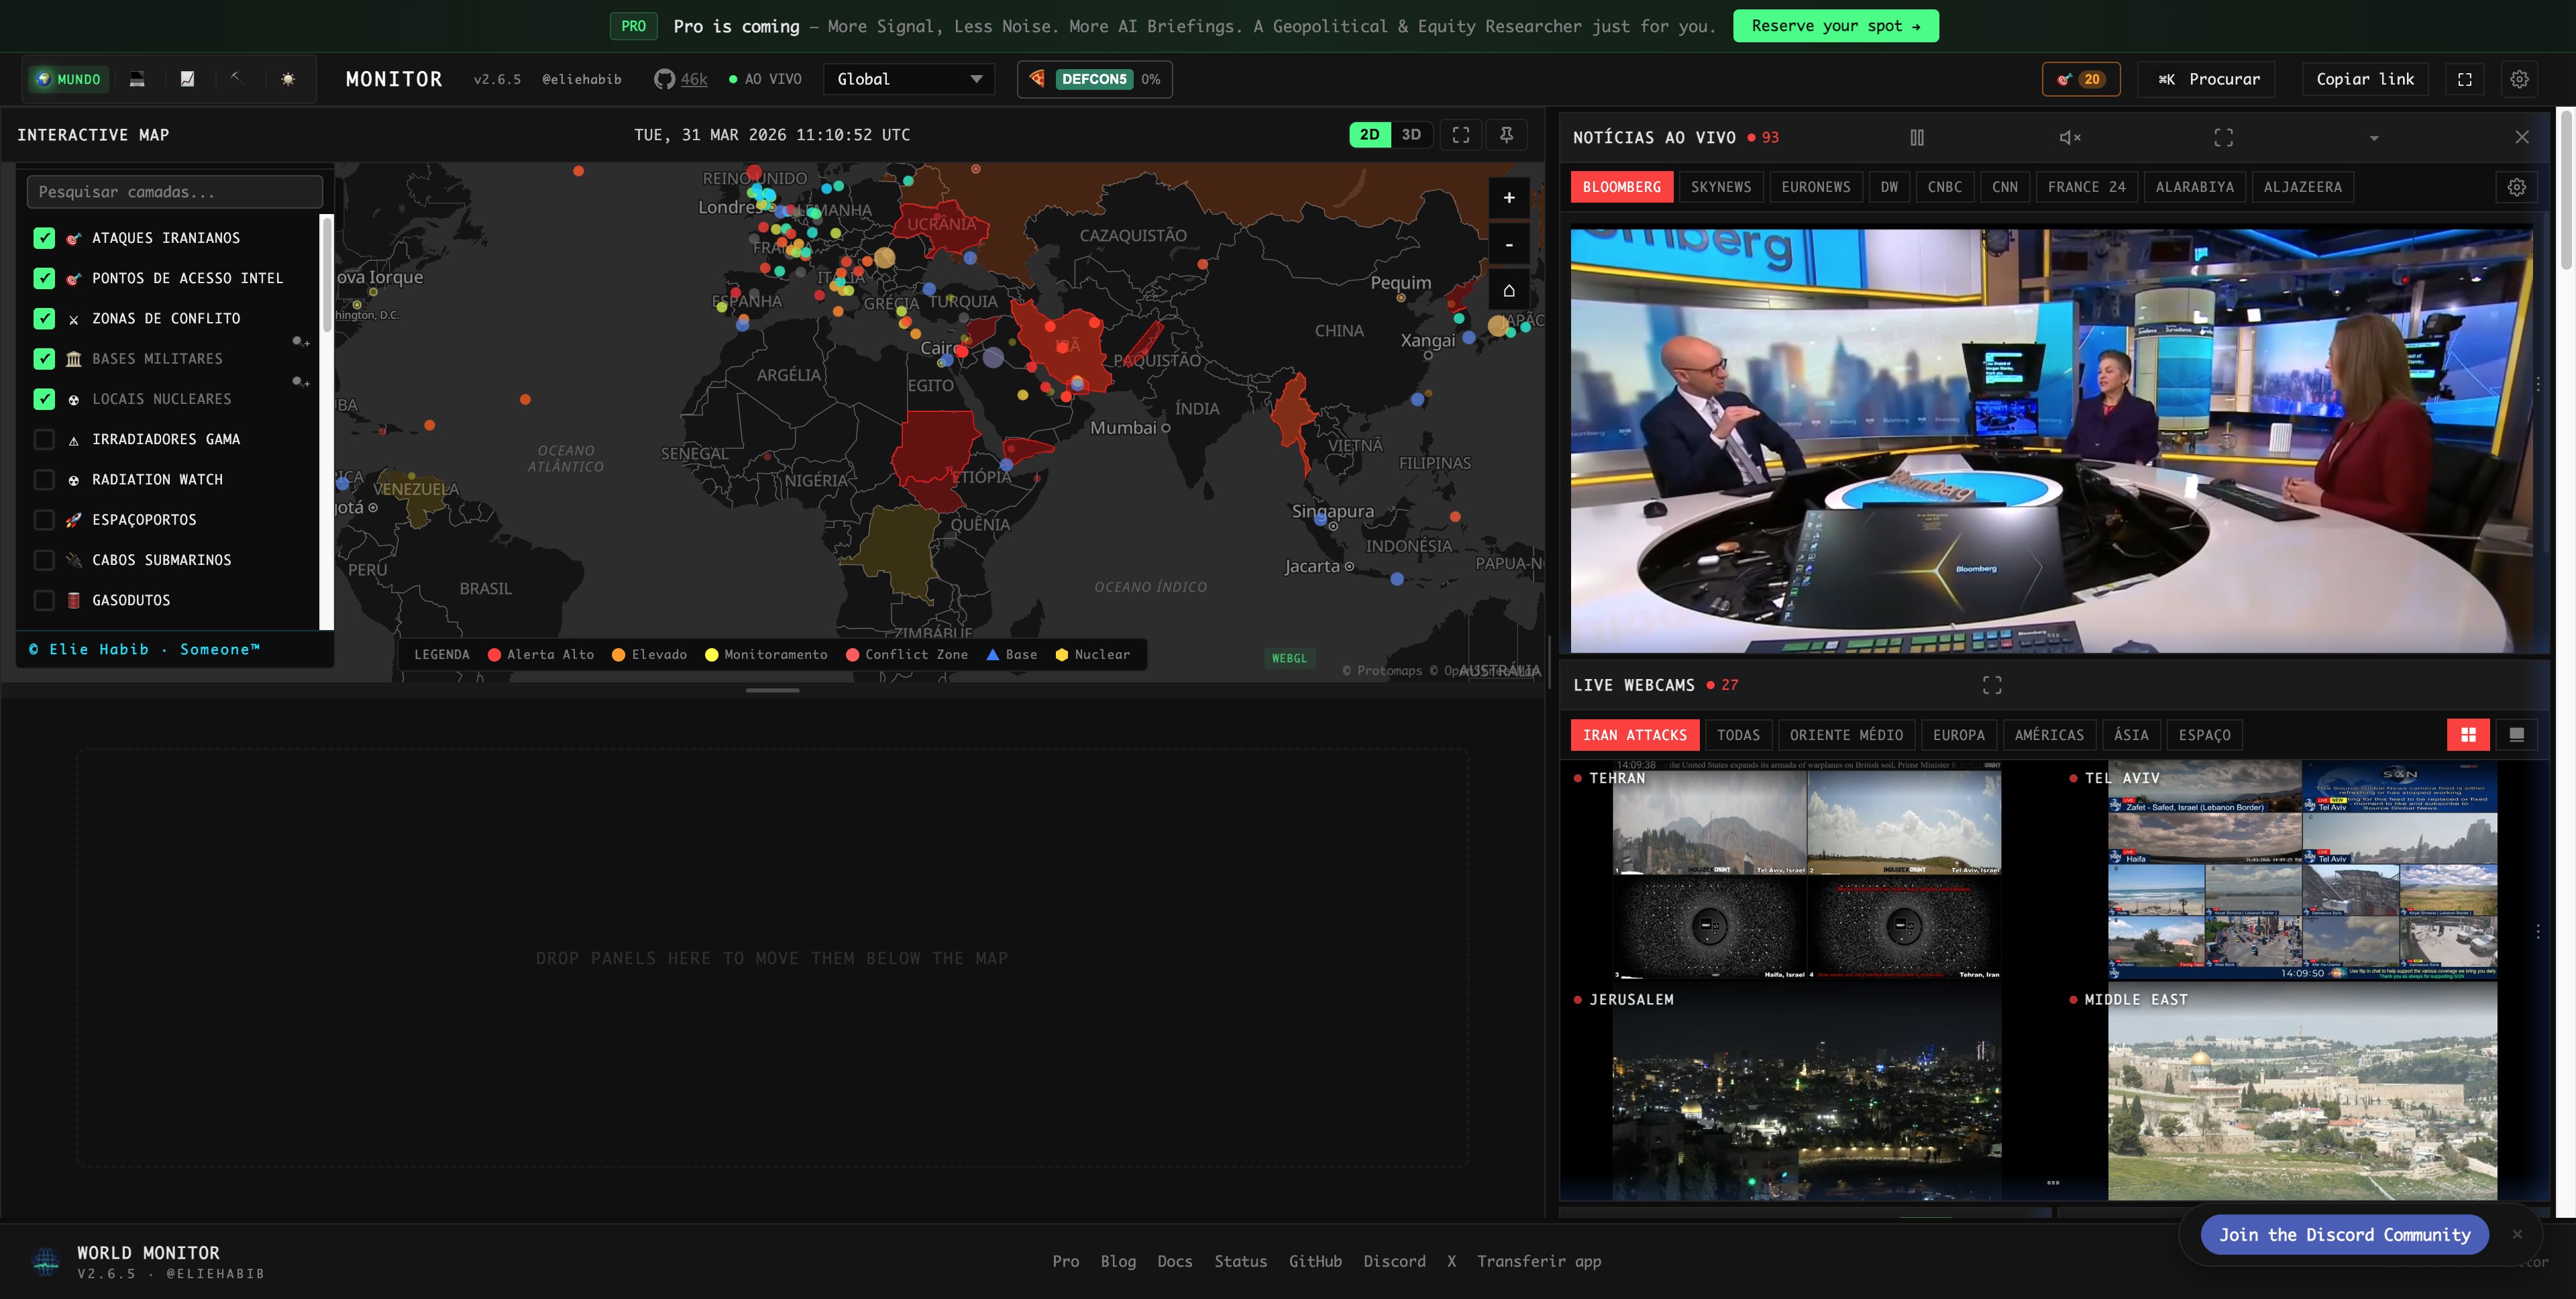

City Monitor
BerlinOpen-source real-time city dashboard aggregating 20+ public data feeds (weather, transit, news, air quality, water levels, police reports, and more). Currently covering Berlin. Easy to apply to other cities.
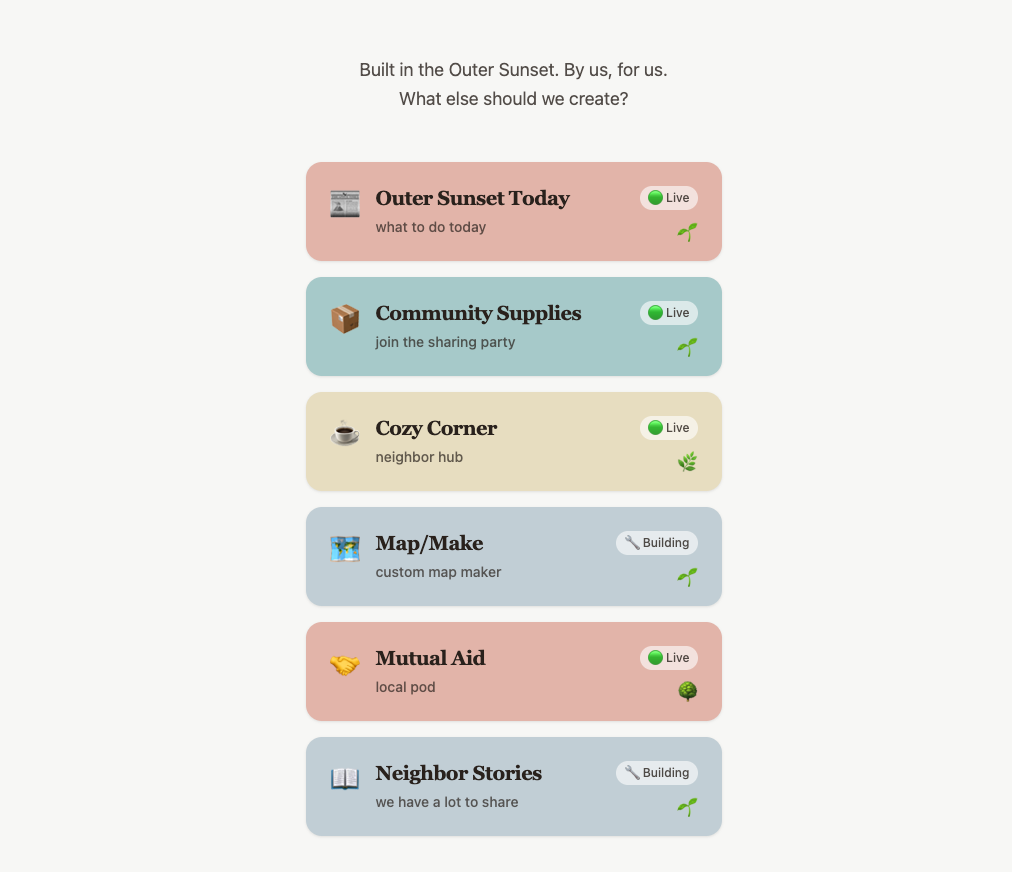
Community Apps Dashboard
San FranciscoA dashboard or directory showcasing community-built digital tools and resources created by and for local residents.


OCHA carried out two global survey to assess the consequences of the US funding freeze on humanitarian action globally. The first round, in February, looked at the impact of the suspension orders and waivers. The second was launched in March following the announcement of the US grants’ termination, in collaboration with IOM, UNHCR and ICVA.

IFRC GO
Williamsburg, VAIFRC GO aims to make all disaster information universally accessible and useful to IFRC responders for better decision making.

Judge Profiles
Berkeley, CAAccess data on immigration judges, including cases, backlogs, grant rates, and removal statistics
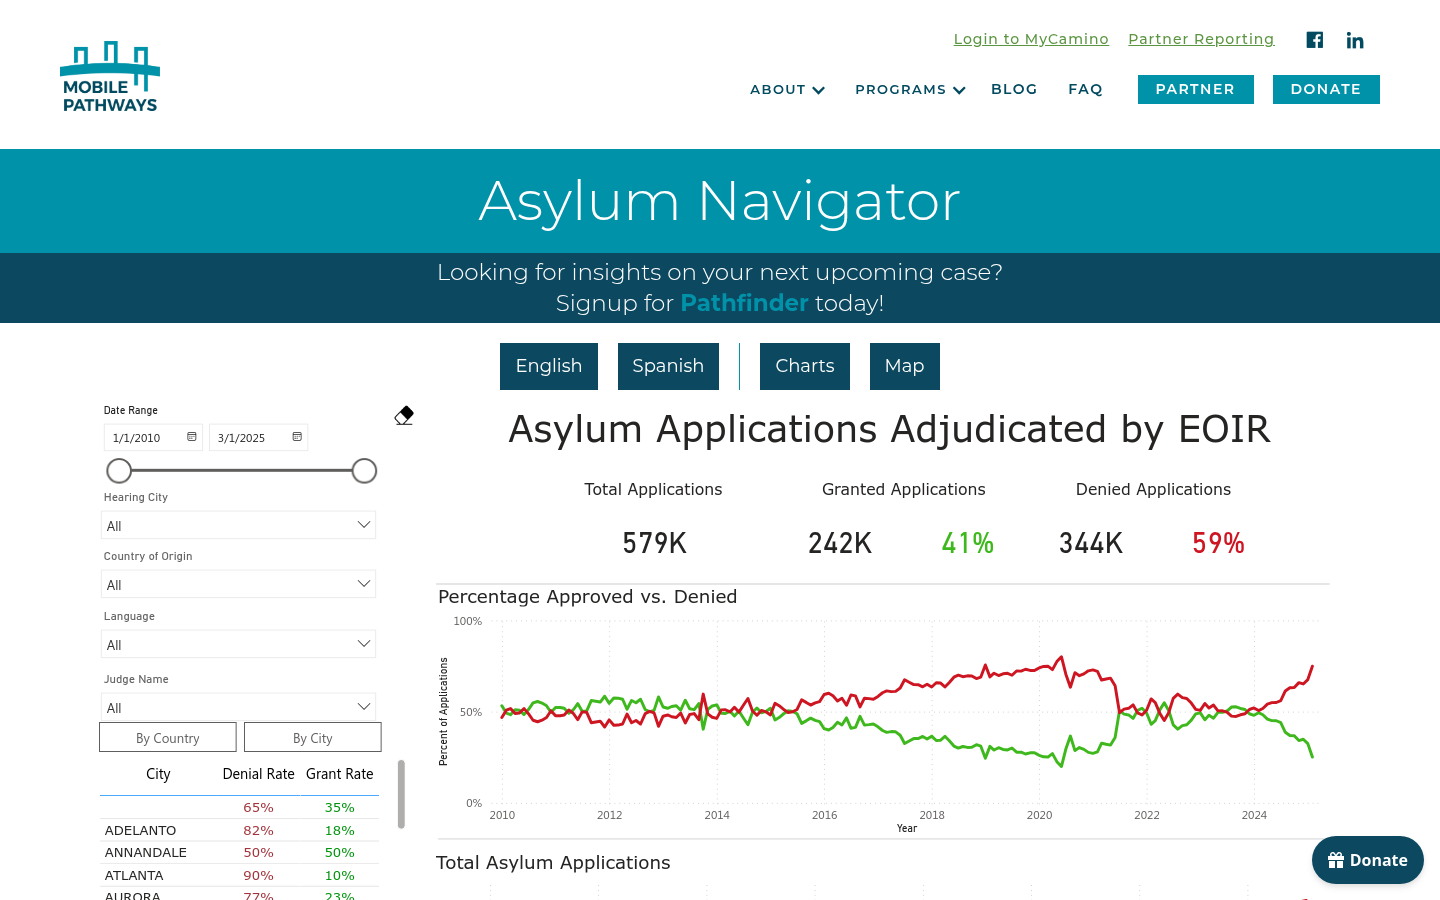
Asylum Navigator
Berkeley, CAAsylum Navigator is a groundbreaking data insights platform designed to empower immigration attorneys and human rights defenders.
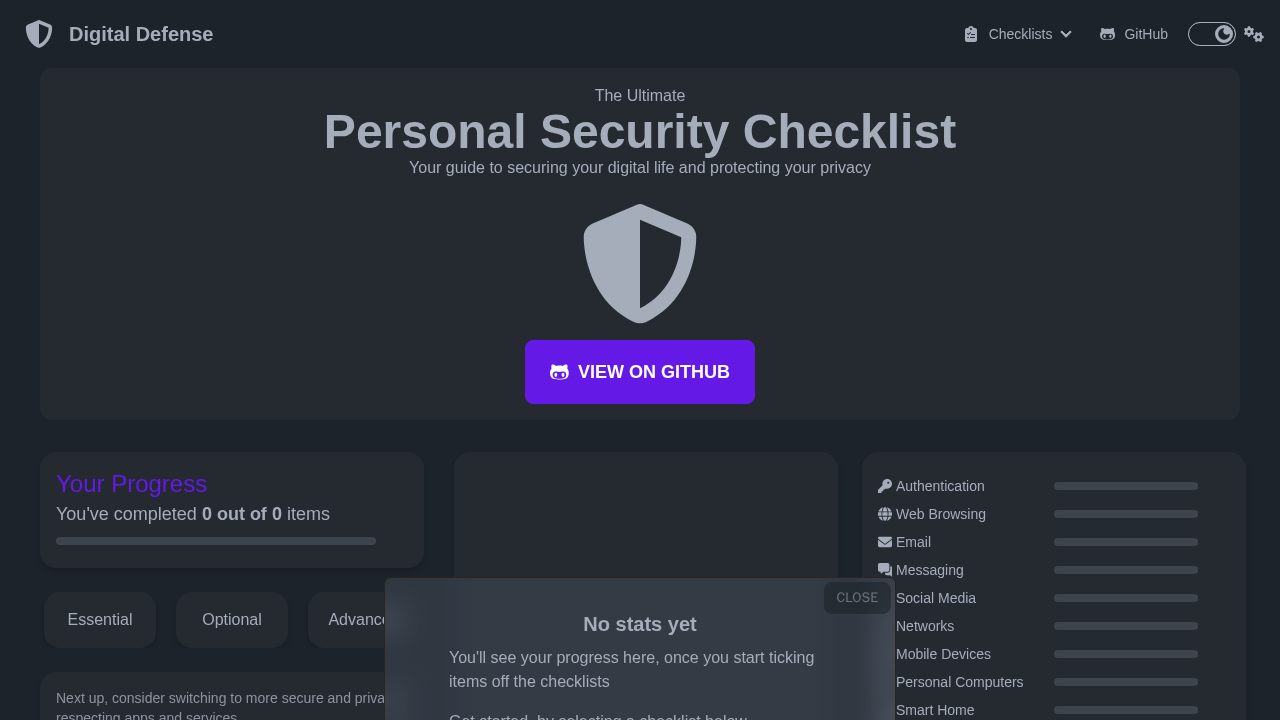
Digital Defense is a comprehensive resource that provides checklists and guides to help individuals secure their digital lives and protect their privacy across various aspects such as authentication, web browsing, email, messaging, social media, and more

Providing an open‑source business intelligence and embedded analytics platform for creating dashboards, querying data, and embedding analytics.

Neighborhood Explorer
Tulsa, OKPlatform for tracking public data metrics for local governments and nonprofits.

CincyInsights
Cincinnati, OhioOur goal is to make government data simple to use, easy to understand, and effortless to access. No data or tech knowledge is required.

SAGA Smart Machinaka Project
Saga, JapanThe SAGA Smart Machinaka Project is a demonstration project that aims to improve the convenience of the city center of Saga City through the use of technologies such as AI and IoT, and to create a city that is easy to live in.

A a mid-century live subway map on Kickstarter
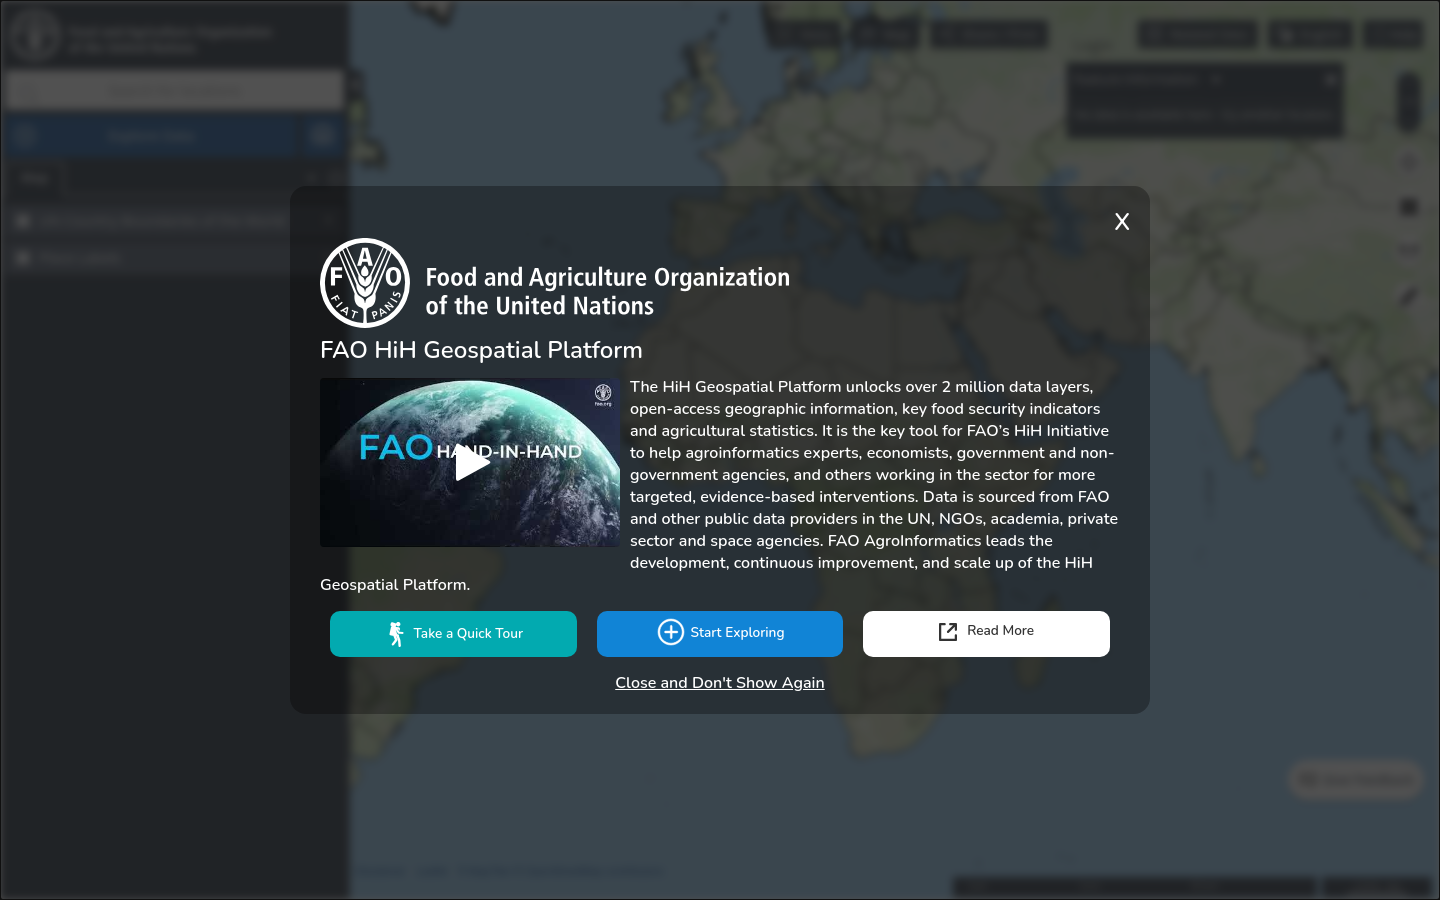
The Hand-in-Hand (HiH) Geospatial Platform is the enabling tool for the HiH Initiative unlocking over 2 million data layers for more targeted, evidence-based interventions.

The Upward Mobility Dashboard helps people understand key conditions affecting upward mobility from poverty and racial equity in communities.
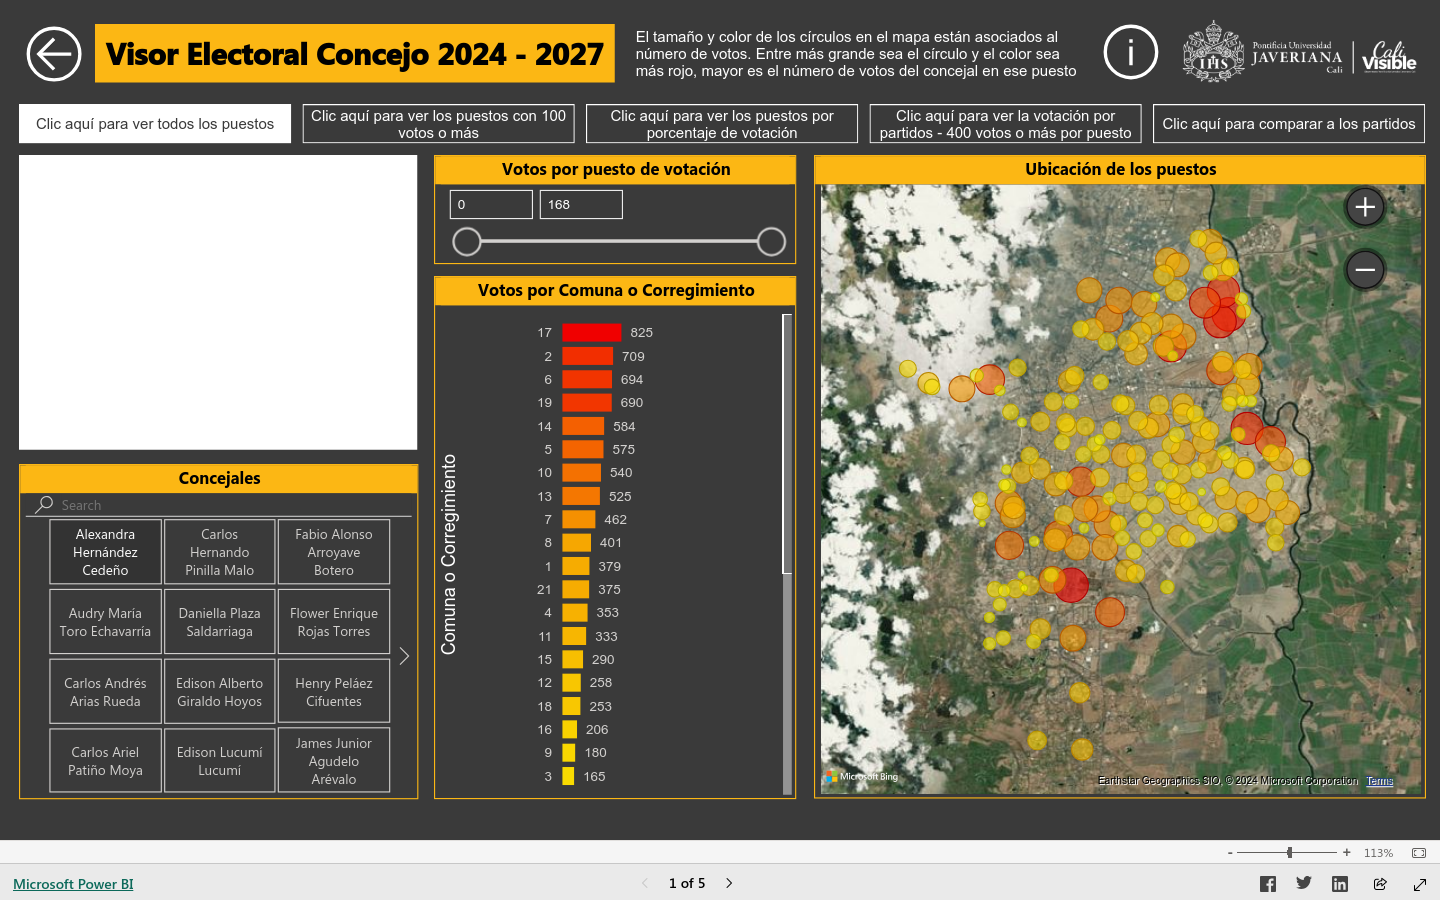
Visor Electroal Concejo 2024 - 2027
Colombia 🇨🇴Vote map and data dashboard showing support for elected representatives in Cali, Colombia
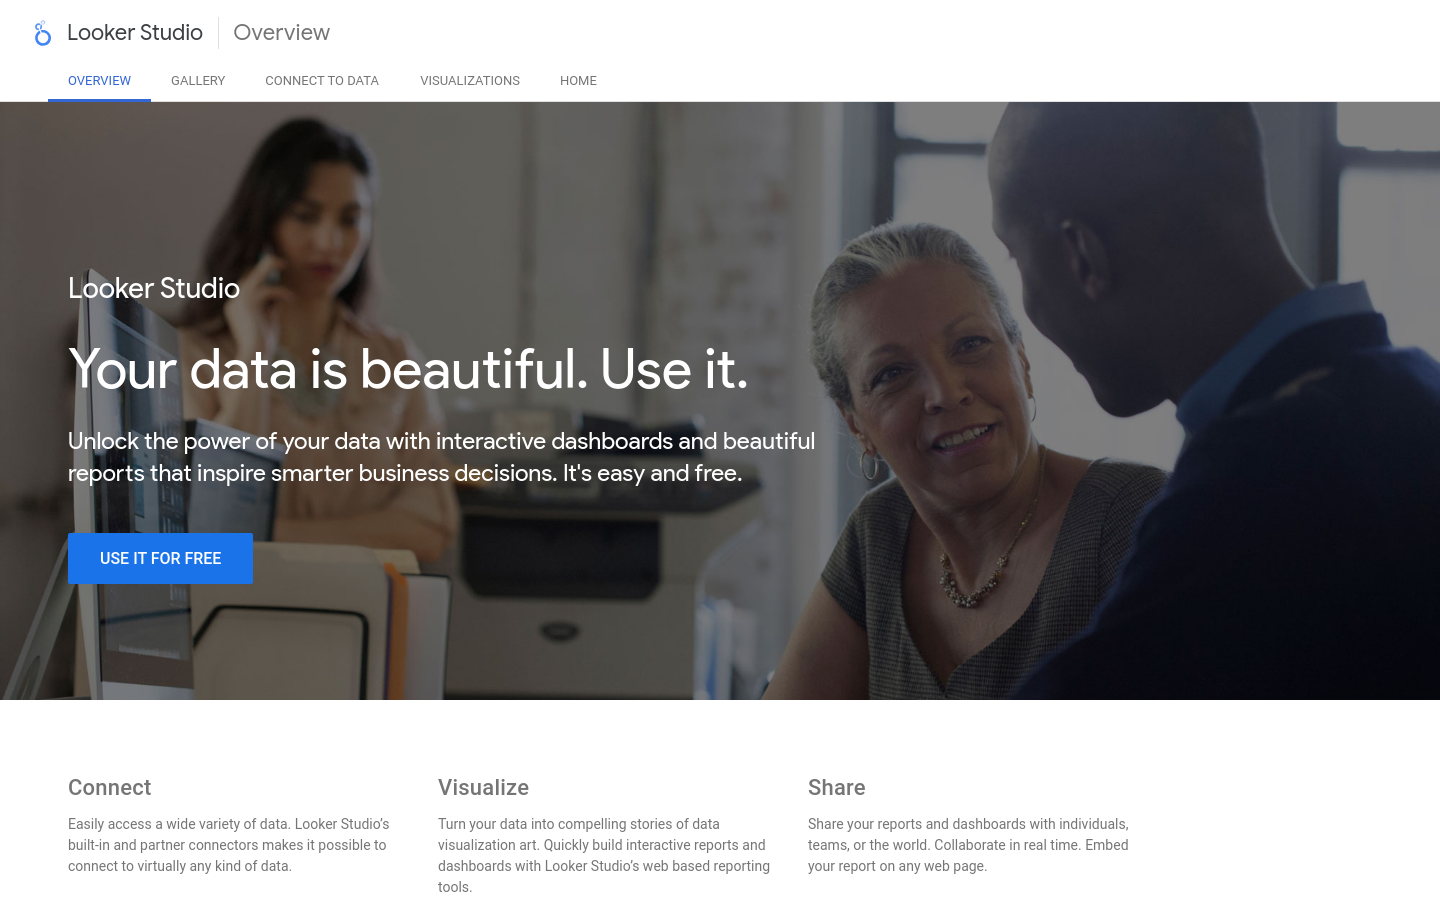
LookerStudio
Mountain View, CAFormerly Google Studio. Unlock the power of your data with interactive dashboards and beautiful reports that inspire smarter business decisions. It's easy and free.
RunningMate
Austin, TXCivitech’s campaign management platform, RunningMate, is the affordable solution for campaigns of all sizes and budgets.

PoliDashboard
TorontoAn app for tracking political advertisements on Meta-owned advertising platforms such as Facebook and Instagram.

Urban Platform
Portugal 🇵🇹A web solution designed for governments that provides the digital twin of the city, and delivers a real-time view of every street, plus insightful analytics to support decision-making and increase the efficiency of the city operations.
Get email updates
Helpful Links
Reach Out
A project of

With support from
National Endowment for Democracy
Founding Organization
Civic Hall
Technology partner