Civic Tech Field Guide
Sharing knowledge and productively growing the fieldSearch Results - Dash (62)
Showing 62 Results

Dash makes any car a 'smart car'. Our app, for Android and iOS, connects to your car with a low-cost, easy to install device, called a ODB2. We use the information on your driving habits to make the roads smarter, safer, greener, more affordable and more social.

PoliDashboard
TorontoAn app for tracking political advertisements on Meta-owned advertising platforms such as Facebook and Instagram.

An online organizing forum for DoorDash workers to fight low wages

At the Integrity Institute, we are tracking how misinformation performs on platforms to measure the extent to which platforms are amplifying misinformation, and the extent to which they are creating an incentive structure that rewards lies and misinformation online.

River Sentiment Dashboard
University of Oxford, 1 St Giles', Oxford OX1 3JS, UKLinking river health to wellbeing in the Thames basin

The Social Media Dashboard for the German 2021 Federal Election
Germany (Deutschland)A live dashboard analyzing the top German candidate's presence on multiple social media platforms.

In the "Widely Viewed Content Report", Facebook provides the 20 individual links and 20 individual posts that were seen by the highest number of people, in the US, for the quarter. In this dashboard, we are tracking objective properties of these 20 posts, links, and the producers behind them, as well as the extent to which it is possible for Facebook users to assess the content from a media literacy perspective.


State-by-state info making it easier to vote

This dashboard allows you to interact with first of its kind quantifiable data on China’s public diplomacy efforts from two of AidData’s reports Ties That Bind and Influencing the Narrative. This includes metrics for five types of public diplomacy: financial, cultural, elite-to-elite, exchange, and informational. Using this dashboard you can create custom data sets, maps and graphs based on the type of public diplomacy, recipient countries and time periods in which you are specifically interested.

District Info NYC dashboard
New York CityLearn about the issues that are important to New Yorkers in your Council District and across the city, from potholes to affordable housing to the immigrant experience and beyond.

Ideas for a hackathon. Upload your project. Add colaborators. Inform status. Share your app.

Gov.UK Performance Dashboards
The United Kingdom of Great Britain and Northern IrelandIf you’re a government service manager, you can see how your service is doing by using a Performance Dashboard. A dashboard lets you quickly spot problems with your service so you can take action to improve it.

Brookings Democracy Dashboard
Brookings Institution, Massachusetts Avenue Northwest, Washington, DC, USAThe Brookings Democracy Dashboard is a collection of data designed to help users evaluate political system and governmental performance in the United States.

Investigative Dashboard
MarylandInvestigative Dashboard makes public documents (such as financial or property records) searchable and more useful for journalists investigating money laundering or corruption.

The Humanitarian Information Dashboard (HID) tracks and analyzes community views and humanitarian related data during emergencies.

A dedicated dashboard to understand coronavirus searches

Criminal Court Data Dashboard
Harris County, TXOver the course of a year and several public information act requests, Texas Criminal Justice Coalition and January Advisors assembled over a million criminal court dispositions throughout Harris County.

Search the list of progressive organizations to find the right opportunity for taking action based on your interests.

Popvox Legidash
Bay Area, CA, USAThe Democracy Fund is a bipartisan foundation working to ensure that our political system is able to withstand new challenges and deliver on its promise to the American people.
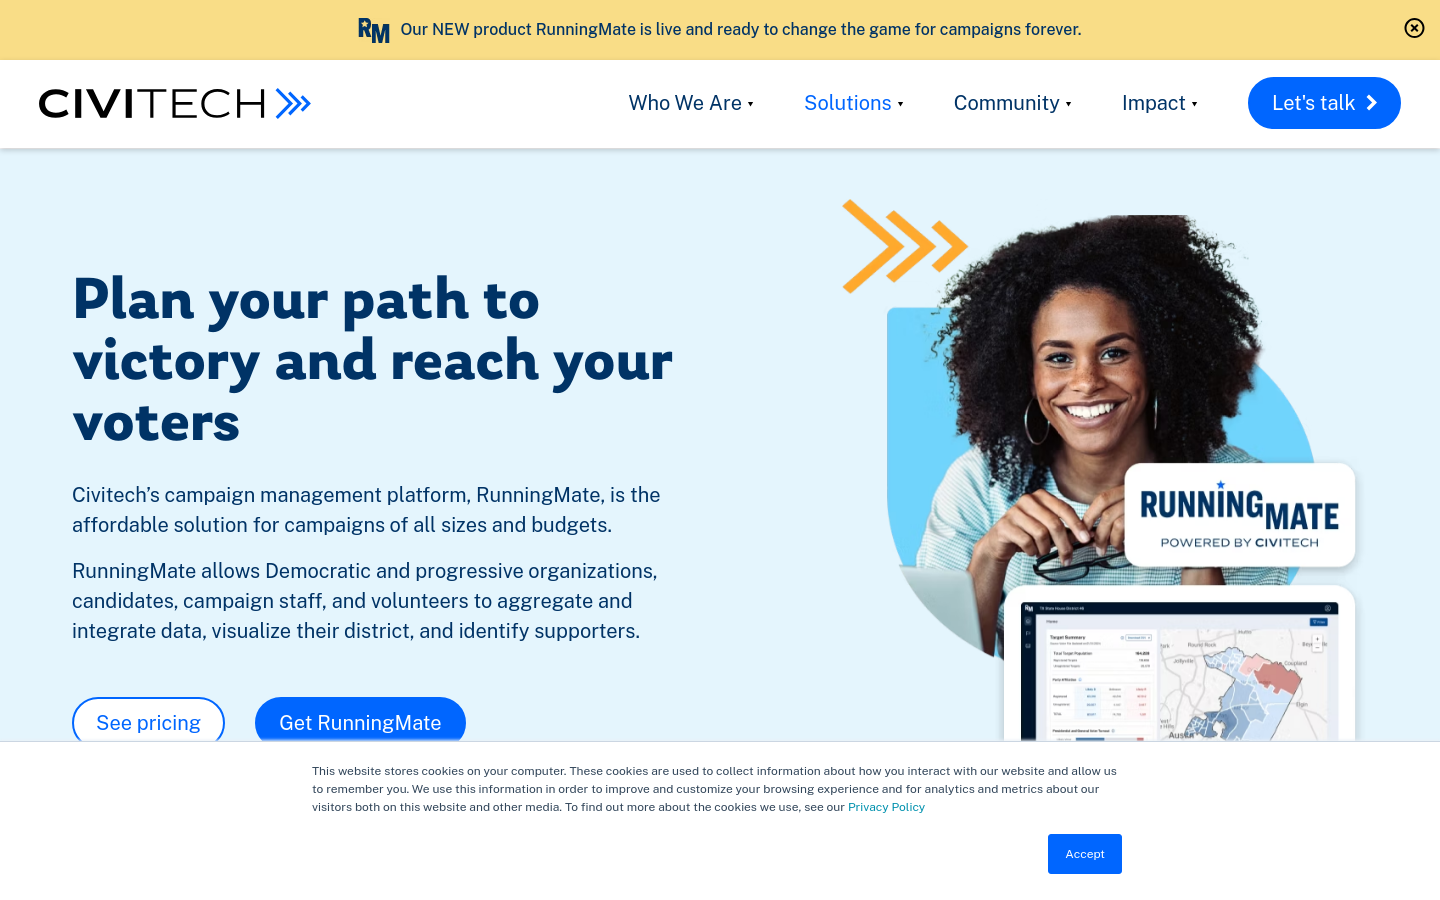
Civitech’s campaign management platform, RunningMate, is the affordable solution for campaigns of all sizes and budgets.

DOLL Living Lab
CopenhagenOur expansive 1.5 km2 industrial area, frequented by over 10,000 daily users, functions as a vibrant physical testing space of smart city environments – now also offering a real-world platform with a digital twin for urban innovation at a 1:1 scale.

Real-time Quadratic Voting dashboard to encourage mathematically optimal voting in democratic communities.

Landlord Tech Watch
United States of America (the)Campaign website explaining landlord / proptech surveillance and what tenants can do to fight back

Your one stop government solution shop

Urban Platform
PortugalA web solution designed for governments that provides the digital twin of the city, and delivers a real-time view of every street, plus insightful analytics to support decision-making and increase the efficiency of the city operations.

Andrew Hyder Government Service Improvement Award
18F, Technology Transformation ServicesTTS annually awards the Andrew Hyder Government Service Improvement Award to one or more federal employees who demonstrate both excellence in their work and a commitment to improving the public’s experience with government. This award commemorates the life and work of Andrew Hyder, a consulting software engineer at 18F who tragically passed away in 2021.

Colorado Broadband Hub
ColoradoThe Colorado Broadband Office (CBO) leads the statewide effort to expand broadband coverage and quality for all Coloradans and coordinates all broadband efforts for Colorado.

This interactive dashboard displays the themes in fact-checking articles we scraped from IFCN-certified websites in the selected week.

ImpactBoard
Johannesburg, South AfricaImpactBoard is a data management solution (and dashboard) that provides programmes with intelligence to achieve impact.

BotSlayer is an application that helps track and detect potential manipulation of information spreading on Twitter.

The Hamilton 2.0 dashboard, a project of the Alliance for Securing Democracy at the German Marshall Fund of the United States, provides a summary analysis of the narratives and topics promoted by Russian, Chinese, and Iranian government officials and state-funded media on Twitter, YouTube, state-sponsored news websites, and via official diplomatic statements at the United Nations.

Iffy Quotient
University of Michigan, South State Street, Ann Arbor, MI, USAThe Iffy Quotient is a metric for how much content from “Iffy” sites has been amplified on Facebook and Twitter.

BusStat.NYC
New York CityA project to measure and show bus performance in NYC

By layering data relating to different social and environmental indicators, we hope to build a better picture of the circumstances of people living in urban areas and how their environment impacts their health.


Novoville
LondonPlatform to help local government interact with residents, including social-media-based consultation processes

Know Your Budget!
UgandaKnow Your Budget is an initiative committed to giving Ugandan citizens access to timely and accurate budget information, and real opportunities to participate in government budget processes. You can learn about the Budget process on the Budget Basics pages. You can access and download budget and expenditure data through the Budget Dashboard. You can access published government documents through the Budget Library.

Populus
San FranciscoA PLATFORM FOR CITIES TO MANAGE THE FUTURE OF MOBILITY

Pulse
Stanford University, Serra Mall, Stanford, CA, USACommunicate your stance on issues you care about directly to your congressperson

This searchable database indexes visual and geospatial solutions to critical urban problems.

Upwell Attention Lab
San FranciscoWe play a unique role, experimenting with injecting conservation messaging into online conversations about the ocean. We do this through “attention campaigns.”

OpenGov’s comprehensive open data and financial transparency solutions help agencies of all sizes drive accountability, make data more useful, engage the public, and unlock economic potential. OpenGov is the first complete cloud solution for public sector budgeting, operational performance, and citizen engagement.


With Trimble at your side, you can harness geospatial data collection and measurement technologies, field inspection and asset management tools, as well as analysis systems to engage with citizens, collaborate with business partners, and manage change and compliance to optimize your operations and workforce.


Collect the place-based data you need using our easy mobile tools and web dashboard. Create your own survey or engage around community health, safety, commercial development, blight, historic resources, and more. Quickly export your data for Excel or as a Shapefile.

The All-in-One Campaign Management Dashboard for Democrats and Progressives

NYC Taxi and Limousine Commission Data Hub
33 Beaver St, New York, NY 10004, USATLC Data Hub offers users a new and convenient location to access and visualize taxi and for hire industry data.

WindyGrid
Chicago, ILWindyGrid is a computer application, designed for City personnel, that makes Chicago’s big data easily and strategically accessible in one place.
Get email updates
Helpful Links
Reach Out
A project of

With support from
National Endowment for Democracy
Founding Organization
Civic Hall
Technology partner

 Civic Tech Field Guide